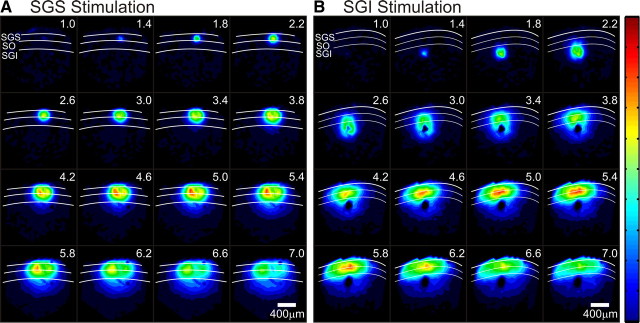
Figure 8.
A, B, Serial images 1–7 ms after electrical stimulation (every 0.4 ms). White curves denote the layers of the SC and layers are labeled in the first record (1 ms after stimulation). All records are normalized to the same maximum and signal amplitude is encoded as color, with hotter colors indicating higher amplitude signals. The color scale is shown on the right. Scale bars, 400 μm. A, Time course of optical responses after stimulation of the SGS. B, Time course of optical responses after stimulation of the SGI.

