Figure 9.
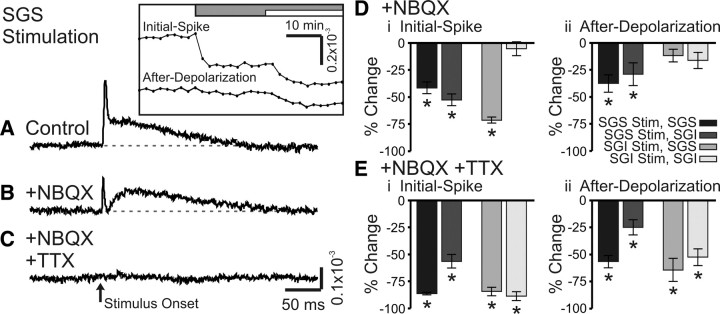
NBQX and TTX block optical signals evoked by SC stimulation. A, Control trace from a single photodiode within the SGS following SGS stimulation (N = 1). The inset shows the time course of drug application for the two components, the initial-spike and the after-depolarization. The gray bar indicates the time of the addition of 5 μm NBQX to the bath solution. The white bar indicates the time of addition of 5 μm NBQX plus 300 nm TTX to the bath solution. B, Optical signal as in A after addition of NBQX (N = 1). C, Optical signal as in A, after addition of NBQX plus TTX (N = 1). The arrow indicates the time of stimulation. Di, Percentage change of the initial-spike component (0–10 ms) from control following addition of NBQX (N = 5). Shades of gray indicate stimulation (Stim) site and recording layer. Vertical lines through the bars indicate SE. *p < 0.05. Dii, Percentage change of the after-depolarization component (20–160 ms) from control following addition of NBQX (N = 5). E, Same as in D, after bath application of NBQX and TTX (N = 5).

