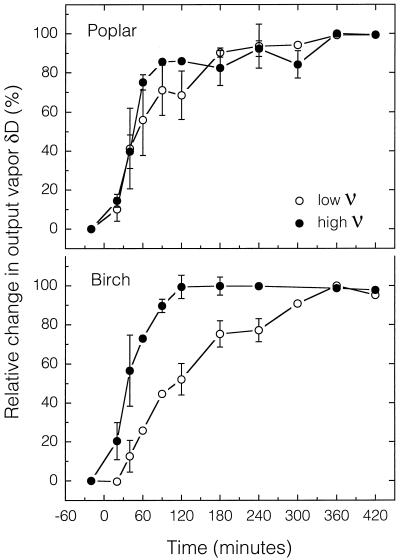
Figure 1.
Time course of the relative change in output vapor δD after a step change in input vapor δD (time 0) for leaves of birch or poplar exposed to high or low ν. Values are means ± se (n = 2). A missing error bar implies that a sample was lost (n = 1) unless the data are near 0% or 100%, in which case the error bars are often within the symbol. If a symbol is missing then both samples were lost due to technical difficulties.

