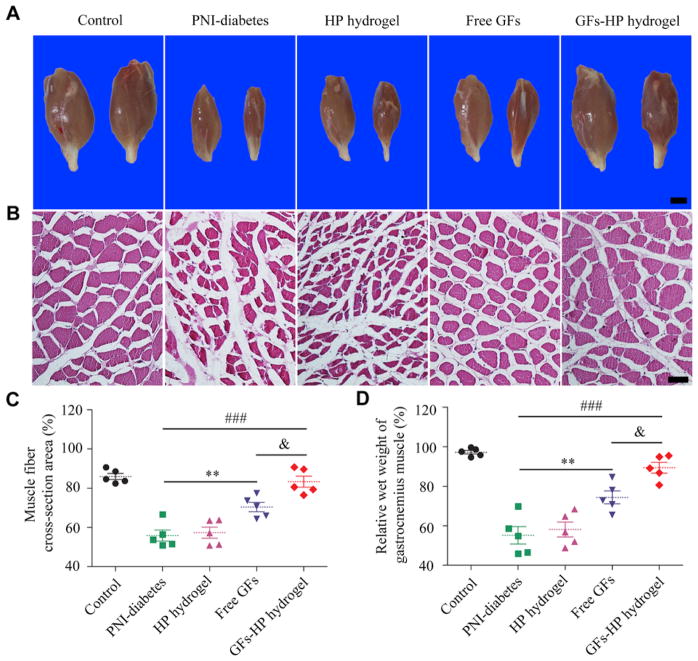
Fig. 4.
Analyses gastrocnemius muscle morphology and wet weight for evaluation of post-injury muscle atrophy. A, Representative photographs of gastrocnemius muscles from both hind limbs in each group. Scale bar, 25mm; B, Representative light microscopy images of cross-sectioned gastrocnemius muscles following H&E staining 30 days post-injury. Scale bar, 50μm; C. Histograms showing the percentage of cross-sectional area of muscle fibers quantified with Image-Pro Plus software analysis of light microscopy results; D. Wet weight ratios of gastrocnemius muscles in each group at 30 days post injury. Free GFs vs PNI-diabetes: **P <0.01, GFs-HP hydrogel vs PNI-diabetes: ###P <0.001, GFs-HP hydrogel vs Free GFs: &P <0.05. All data represent mean values±SEM, n=5 for each group.

