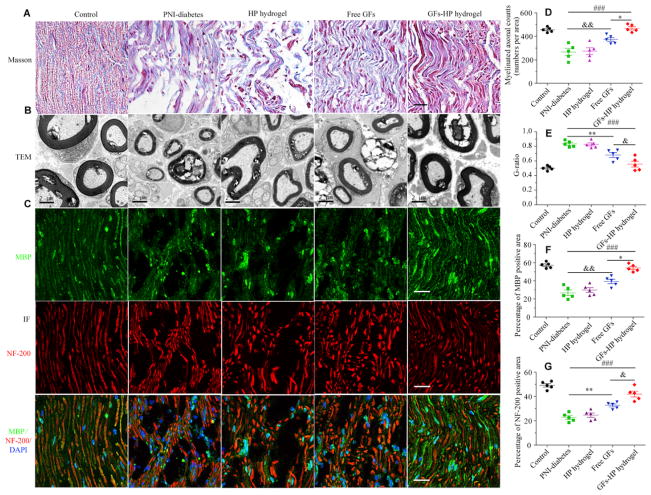
Fig. 5.
Histological and microstructure evaluation of injured sciatic nerve. A. longitudinal sections of regenerated nerve stained with Masson’s trichrome 30 days after injury, Scale bar=50μm; B. TEM images of cross-sections of lesion regions, Scale bar=2μm; C. Double immunofluorescence staining for NF-200 and MBP-positive cells of the longitudinal sections in each experimental group. Scale bar=25μm; D, E. Quantification analysis of myelinated axonal count and G-ratio (G-ratio=axon diameter/fiber diameter) in the indicated groups; F, G. Quantitative analyses of fluorescence intensity of pixels for MBP and NF-200. Values are expressed as mean±SEM, n=5 per group. Free GFs vs PNI-diabetes: *P <0.05, **P <0.01, GFs-HP hydrogel vs PNI-diabetes: ###P <0.001, GFs-HP hydrogel vs Free GFs: &P <0.05, &&P <0.01.

