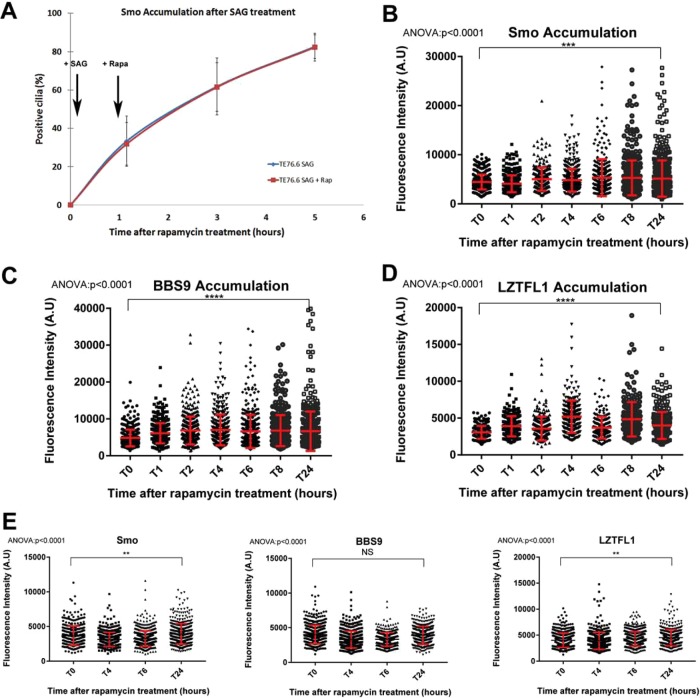
FIGURE 5:
Independent entry of hedgehog effectors in the cilium. (A) Quantification of Smo-positive cilia after activation of the pathway with SAG (added at 5 min) and treatment with rapamycin (added at 1 h to half of the samples). (B) Quantification of Smo fluorescence intensity over time in rapamycin-treated unstimulated 76.6 cells. Rapamycin was added at time zero, no SAG was added. (C) Quantification of BBS9 fluorescence intensity after activation of the pathway under the same experimental paradigm as in B. (D) Quantification of LZTFL1 fluorescence intensity after activation of the pathway under the same experimental paradigm as in B. (E) Quantification of Smo, BBS9, and LZTFL1 fluorescence intensity over time in rapamycin-treated unstimulated wild-type cells. Data were analyzed using one-way ANOVA with Dunett’s multiple comparison test. In each panel, ∼300 cells were counted. Error bars are SD.

