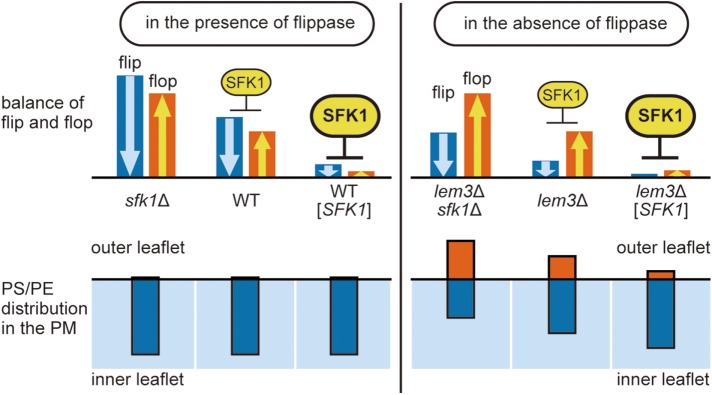
FIGURE 10:
Model for the Sfk1p action. Top panel, Blue and orange bars represent the rate of flip and flop, respectively. In this model, Sfk1p represses both flip and flop in a dose-dependent manner. Bottom panel, Blue and orange bars represent the distribution of PS/PE in the inner and outer leaflet of the plasma membrane, respectively. Deletion or overexpression of SFK1 affects phospholipid asymmetry in the absence of flippase (right) but not in the presence of flippase (left).

