FIGURE 1:
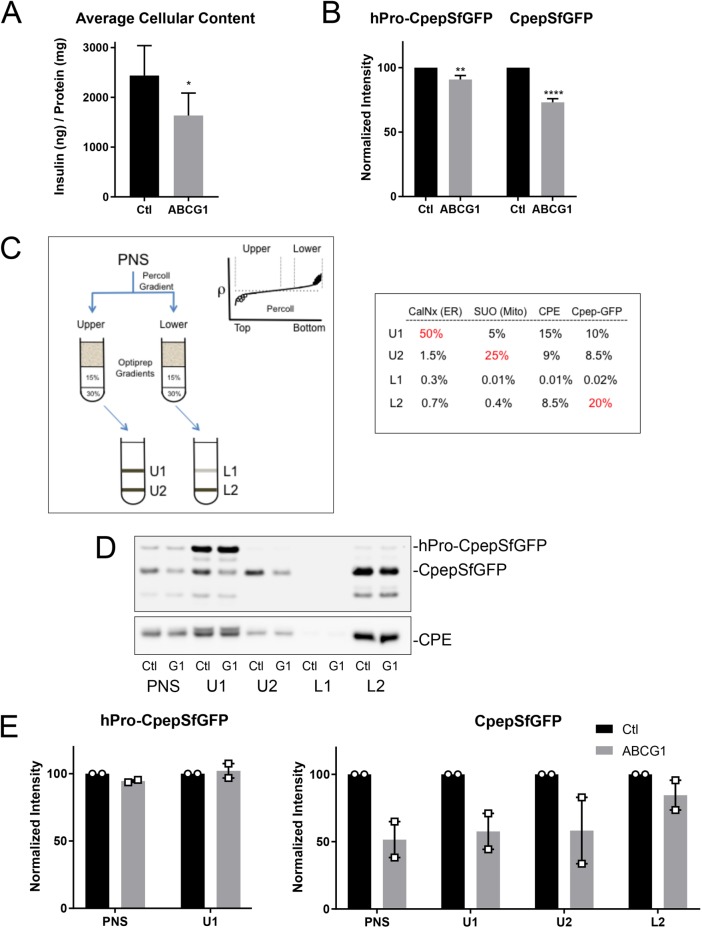
RNAi-mediated depletion of ABCG1 reduces the levels of secretory proteins in insulin-secreting cells and also inhibits stimulated secretion. (A) Levels of insulin in INS1 cells measured by ELISA following treatment with siRNA (control or ABCG1-targeted smart pool); n = 7. (B) Levels of hPro-CpepSfGFP and CpepSfGFP in GRINCH cells quantified from Western blots following control and ABCG1 knockdowns; n = 20. Data are presented as mean ± SEM. p values determined by Student’s t test; *, p < 0.05; **, p < 0.01; ****, p < 0.0001. (C) Isoosmotic fractionation protocol used to resolve granule populations and accompanying distributions of marker proteins in the subfractions (PNS, postnuclear supernatant; U1, U2 and L1, L2) resolved on the iodixanol gradients from the upper (lower density) and lower (higher density) bands of the Percoll gradient, respectively. Markers are as follows: CalNx, calnexin (ER); SUO, succinate-ubiquinone oxidoreductase (mitochondria); CPE, carboxypeptidase (condensing vacuoles, immature and mature granules); Cpep-GFP, CpepSfGFP. Percentages in red show principal concentration sites. (D) Western blots showing the distributions of hPro-CpepSfGFP and CpepSfGFP (upper blot) and CPE (lower blot) in fractions obtained from parallel fractionation of control (Ctl) and ABCG1-depleted (G1) cells. As discussed in the text and shown in Figures 3C and 6C, the band running below CpepSfGFP appears to be an intermediate in the degradation of CpepSfGFP in lysosomes. (E) Two separate fractionations documenting little or no loss of hPro-CpepSfGFP in PNS and U1 but pronounced loss of CpepSfGFP in PNS, U1, and U2 as compared with L2 following ABCG1 knockdown as quantified from Western blots. Supplemental Figure S2 documents similar loss for CPE but no loss of SUO or CalNx in ABCG1-depleted samples.

