FIGURE 4:
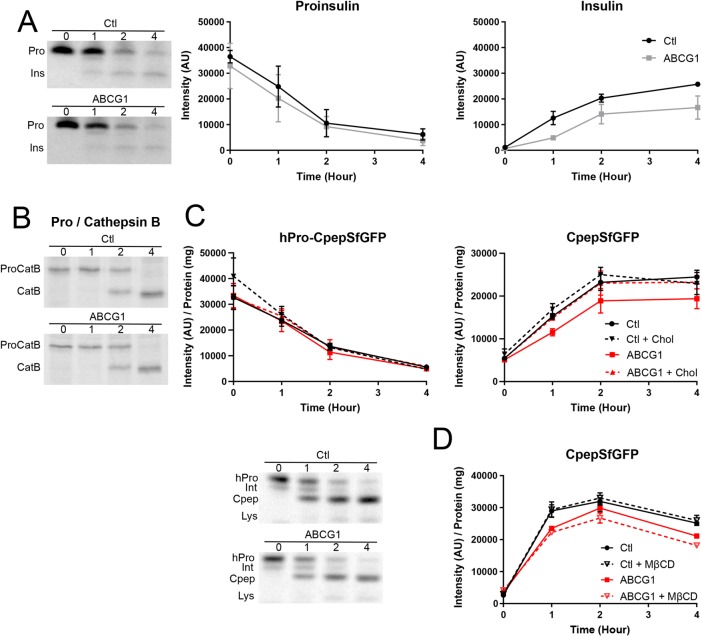
Effects of ABCG1 knockdown on granule formation. (A) Production and processing of 35S-amino acid–labeled proinsulin are not affected by depletion of ABCG1 in INS1 cells. Representative phosphorimage comparing labeled proinsulin/insulin in control and ABCG1 knockdown cells. Quantitative results pooled from three experiments (0–2 h chase; extended to 4 h chase in two of the experiments) show that accumulation of labeled insulin during granule formation is noticeably decreased by ABCG1 knockdown. (B) Transport and processing of procathepsin B (to cathepsin B in lysosomes) is not affected by ABCG1 knockdown. The phosphorimage is representative of two separate experiments. (C) Tracking of hPro-CpepSfGFP and CpepSfGFP in GRINCH cells following pulse labeling with 35S-amino acids. Representative phosphorimage shows the progressive processing of hPro-CpepSfGFP (hPro) through an intermediate (Int) to CpepSfGFP (Cpep) as well as accumulation of a lysosomal degradation band (Lys) in control and ABCG1 knockdown samples. Quantification shows no effect of ABCG1 knockdown or of cholesterol-MβCD addition on the level and processing of hPro-CpepSfGFP. For CpepSfGFP, levels are significantly decreased by ABCG1 knockdown starting at 1 h (p < 0.05). Rescue of CpepSfGFP levels by cholesterol-MβCD addition (ABCG1 + chol) is indicated by no significant difference from control (starting at 1 h) and significant difference (p < 0.05) from ABCG1 (starting at 2 h). (D) Addition of MβCD alone significantly increases the loss of CpepSfFP in ABCG1-deficient samples by 2 h (results for hPro-CpepSfGFP mimic those in C [unpublished data]). Significance determined by two-way analysis of variance (ANOVA); n = 3 in C and in D. Data are presented as mean ± SEM.

