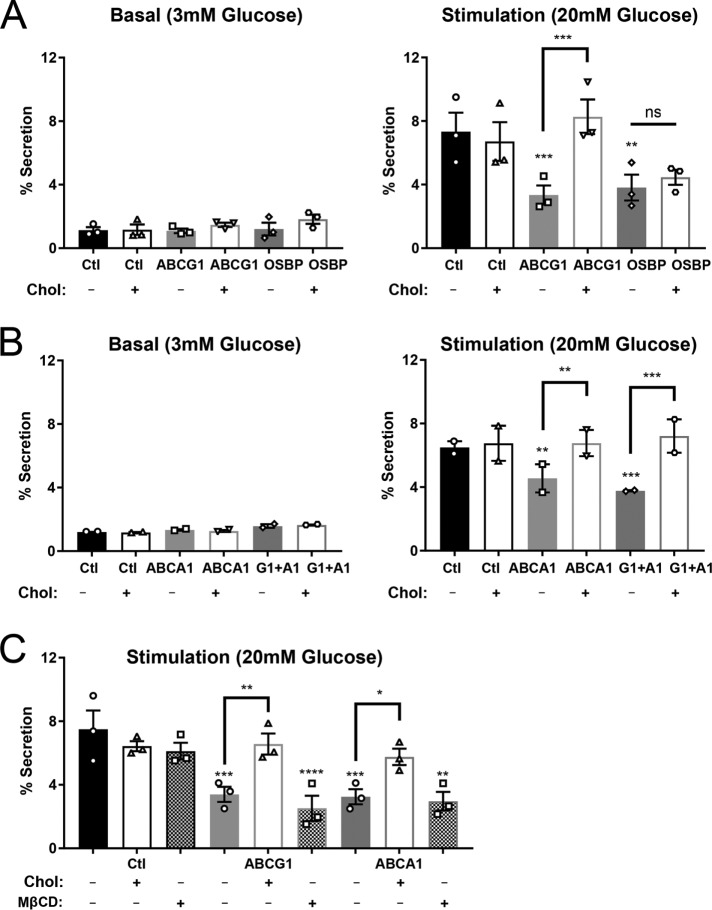
FIGURE 8:
Glucose-stimulated secretion measured by release of fluorescence (SfGFP) is inhibited in cells depleted of ABCG1 or OSBP (A) and ABCA1 and combined ABCs G1 and A1 (B). Addition of 20 μM cholesterol-MβCD restores output in ABCG1-, ABCA1- and ABCG1/A1-depleted samples but not in OSBP-depleted samples. n = 3 (A); n = 2 (B). (C) In contrast to addition of cholesterol-MβCD, addition of MβCD alone does not rescue stimulated secretion; n = 3. Western blot images (Supplemental Figure S8) illustrate the proteins contributing to the fluorescent signal in secretion and cell lysates. Significance was determined by one-way ANOVA. Data are presented as mean ± SEM. *, p < 0.05; **, p < 0.01; ***, p < 0.001; ****, p < 0.0001.

