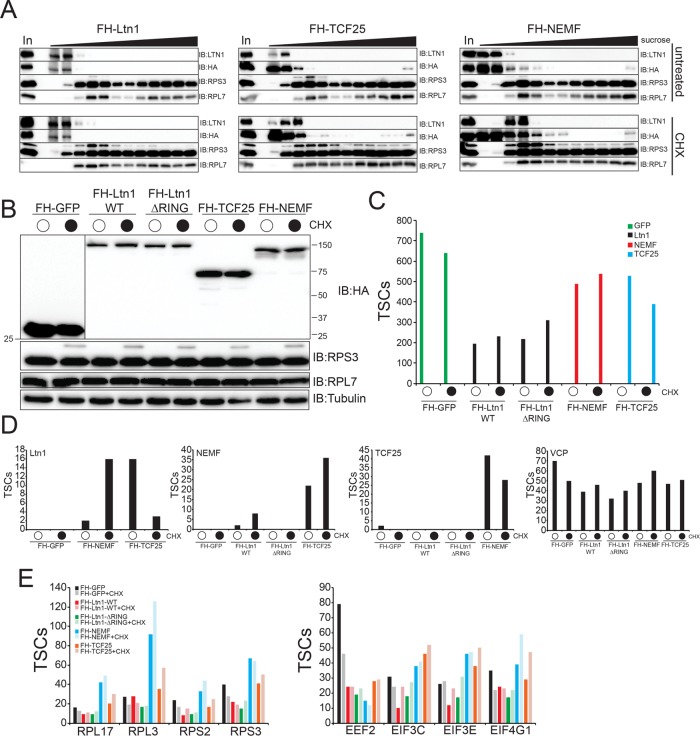
FIGURE 3:
Systematic proteomic interrogation of the mammalian RQC complex. (A) 293 Flp-In cells with dox-induced expression of FLAG-HA (FH)–tagged Ltn1 or TCF25, or 293T cells with constitutive stable-expression of FLAG-HA–tagged NEMF, were either untreated (top) or treated with 100 μg/ml cycloheximide (CHX, bottom) for 1 h. Native cell extracts were separated on a 5–45% linear sucrose gradient. Inputs (In) and isolated fractions across the gradient were immunoblotted as indicated. Note the appearance of the slower migrating ubiquitylated RPS3 in CHX-treated samples as a marker for CHX treatment. (B) 293 Flp-In cells with dox-induced expression of the indicated FH-tagged proteins were either untreated (top) or treated with 100 μg/ml cycloheximide (CHX, bottom) for 1 h. Whole-cell extracts were immunoblotted as indicated. (C) Total spectral counts (TSCs) to the corresponding bait proteins from anti-HA–isolated proteins from cell lines expressing the indicated FH-tagged proteins is depicted. (D) Total spectral counts (TSCs) corresponding to identified Ltn1, NEMF, TCF25, or VCP from anti-HA–isolated proteins from the indicated FH-tagged protein expressing cell extracts. Cells were either untreated or treated with CHX as indicated. (E) Total spectral counts (TSCs) corresponding to the indicated representative proteins for 40S, 60S, and translation initiation factors identified from either untreated or CHX-treated cells from FH-tagged GFP (black)-, wild type Ltn1 (red)-, ΔRING Ltn1 (green)-, NEMF (blue)-, or TCF25 (orange)-expressing cells. For panels C–E, summed TSCs are shown from triplicate runs of individual experiments.

