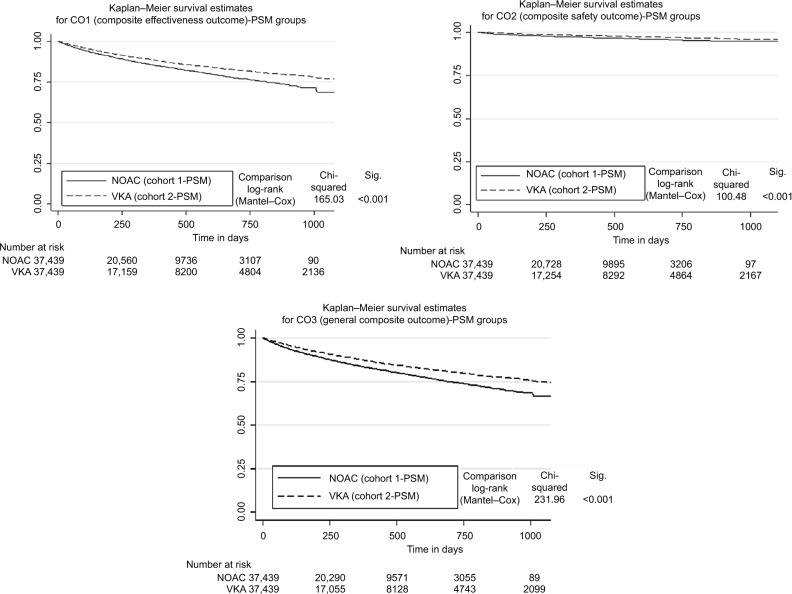
Figure 2.
Kaplan–Meier curves (time to event: CO1, CO2, CO3) for PSM-matched Cohorts 1 and 2.
Abbreviations: CO1: effectiveness composite outcome 1; CO2: safety composite outcome 2; CO3: general composite outcome 3; NOAC, non-vitamin K antagonist oral anticoagulants; PSM, propensity score matching; VKA, vitamin-K-antagonist.

