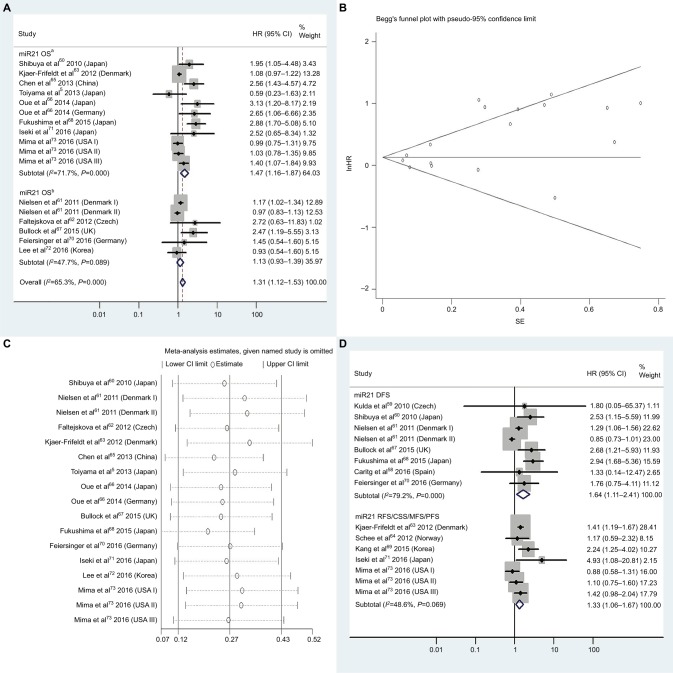
Figure 3.
(A) Forest plots of pooled analyses of OS or OS (multiple-covariate analysis) in association with high tissue miR21-expression levels; (B) Begg’s funnel plot of publication bias for pooled analysis of OS in association with high tissue miR21-expression levels; (C) sensitivity analysis of pooled analysis of OS in association with high tissue miR21-expression levels; (D) forest plots of pooled analyses of DFS or RFS/CSS/MFS/PFS in association with high tissue miR21-expression levels. Weights are from random-effects analysis in A and D. aMultiple-covariate analysis; bunivariate analysis.
Abbreviations: OS, overall survival; DFS, disease-free survival; RFS, recurrence-free survival; CSS, cause-specific survival; MFS, metastasis-free survival; PFS, progression-free survival.

