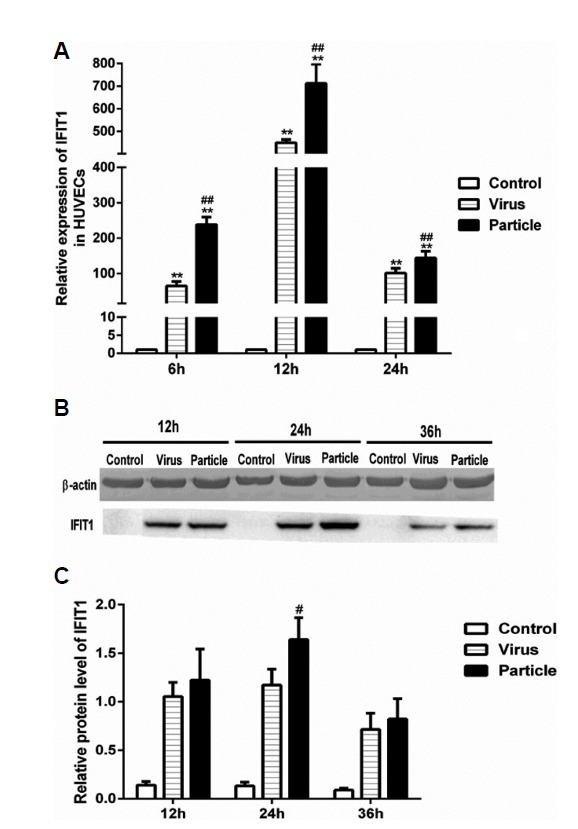
Fig. 3. IFIT1 expression induced by H9N2 virus infection and viral particle inoculation in HUVECs.

HUVECs were infected with H9N2 virus (i.e., Virus) and inoculated with inactivated viral particle (i.e., Particle) at a MOI of 5, cells used for RT-PCR assay were collected at 6 h, 12 h and 24 h postinfection, cells used for western blot assay were collected at 12, 24 and 36 h postinfection. Values represent the means from three independent experiments plus standard deviations. (A) Expression of IFIT1 at mRNA level. (B) Expression of IFIT1 at protein level. (C) The relative protein level of IFIT1 compared to β-actin. *means particle group and virus group compared with control group (*P < 0.05, **P < 0.01, ANOVE). # means particle group compared with virus group (#P < 0.05, ##P < 0.01, t-test).
