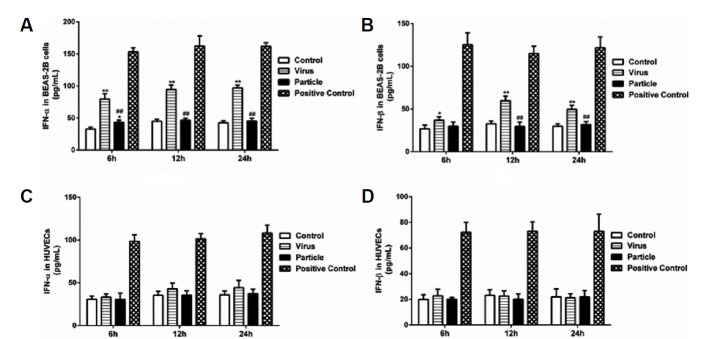
Fig. 4. Evaluation of IFN-α/β production in HUVECs and BEAS-2Bs inoculated with H9N2 virus or viral particle.
HUVECs and BEAS-2Bs were infected with H9N2 virus (i.e., Virus) and inoculated with inactivated viral particle (i.e., Particle) at a MOI of 5, and then supernatants were collected at 6 h, 12 h and 24 h postinfection. Levels of IFN-α/β were detected using human ELISA kits. Values represent the means from three independent experiments plus standard deviations. (A) IFN-α levels in BEAS-2Bs. (B) IFN-β levels in BEAS-2B cells. (C) IFN-α levels in HUVECs. (D) IFN-β levels in HUVECs. *means particle group and virus group compared with control group (*P < 0.05, **P < 0.01, ANOVE). # means particle group compared with virus group (#P < 0.05, ##P < 0.01, t-test).

