
Fig. 3. Identification of atmyb56#1 and atmyb56#2 mutants and subcellular localization of AtMyb56 protein.
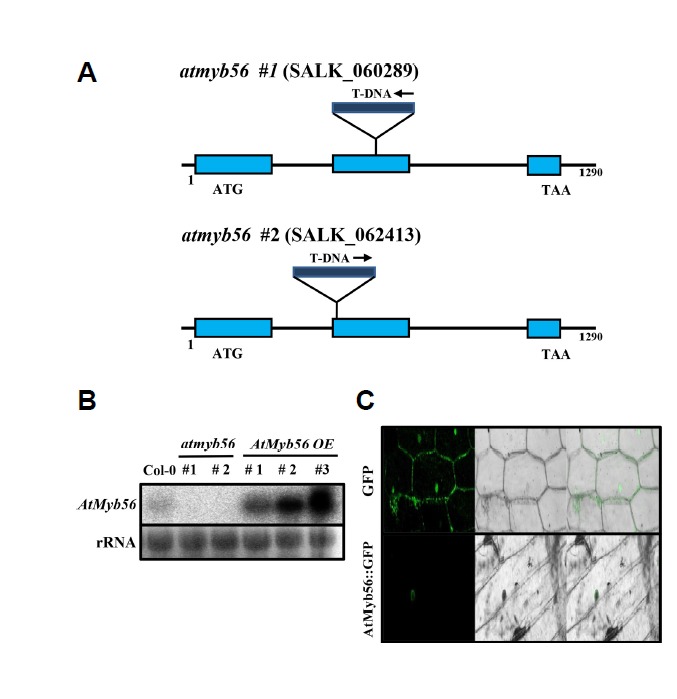
(A) Genomic structure of the AtMyb56 gene showing T-DNA insertions in mutants. (B) RNA gel blot analysis of AtMyb56 gene expression in atmyb56#1, #2, and AtMyb56 OE lines. Total RNA is presented with a loading control. (C) AtMyb56::GFP fluorescence in an onion epidermal cell.