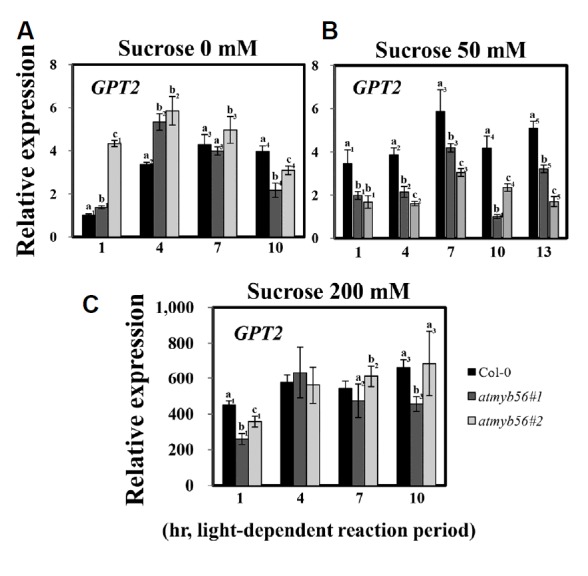
Fig. 7. Determination AtGPT2 transcript levels in Col-0, atmyb56 #1, and atmyb56 #2 seedlings exposed to sucrose.

Transcript levels of AtGPT2 in Col-0, atmyb56#1, and atmyb56#2 seedlings exposed to 0 (A), 50 (B), and 200 mM sucrose (C) were determined by qRT-PCR. Error bars represent the standard errors (SEs) of three biological replicates. Values with different letters are significantly different from the Col-0 plants based on the analysis of variance (P < 0.05).
