

Abstract
K-RAS is mutated in approximately 30% of human cancers, resulting in increased RAS signaling and tumor growth. Thus, RAS is a highly validated therapeutic target, especially in tumors of the pancreas, lung and colon. Although directly targeting RAS has proven to be challenging, it may be possible to target other proteins involved in RAS signaling, such as the guanine nucleotide exchange factor Son of Sevenless (SOS). We have previously reported on the discovery of small molecules that bind to SOS1, activate SOS-mediated nucleotide exchange on RAS, and paradoxically inhibit ERK phosphorylation (Burns et al., PNAS, 2014). Here, we describe the discovery of additional, structurally diverse small molecules that also bind to SOS1 in the same pocket and elicit similar biological effects. We tested >160,000 compounds in a fluorescence-based assay to assess their effects on SOS-mediated nucleotide exchange. X-Ray structures reveal that these small molecules bind to the CDC25 domain of SOS1. Compounds that elicit high levels of nucleotide exchange activity in vitro increase RAS-GTP levels in cells, and inhibit phospho ERK levels at higher treatment concentrations. The identification of structurally diverse SOS1 binding ligands may assist in the discovery of new molecules designed to target RAS-driven tumors.
Keywords: Nucleotide exchange, SOS1, RAS, Small molecule, X-Ray structure, Agonist
Subject Category: Physical Techniques
1. Introduction
Activating mutations in RAS commonly occur at positions 12, 13, and 61. Such mutations are most frequently observed in carcinomas of the pancreas (63-90%), colon (36-50%), and lung (19-30%) [1, 2]. Once activated, mutant RAS promotes oncogenesis by endowing cells with the ability to proliferate, resist apoptosis, alter metabolism, evade the immune system, invade surrounding tissues, and metastasize to distant sites [3]. Thus, RAS is a highly validated target in oncology and perturbation of RAS signaling is considered to be a promising therapeutic strategy [4, 5].
The small GTPase RAS functions as a biomolecular switch, alternating between an inactive GDP-bound state and an active GTP-bound state. Activation of RAS is catalyzed by the guanine nucleotide exchange factor (GEF) Son of Sevenless (SOS), which is responsible for catalyzing the exchange of GDP for GTP on RAS [6]. Our laboratory has discovered a novel strategy to modulate RAS signaling through pharmacological targeting of SOS1. We have previously discovered small molecules that bind to SOS1 and increase the rate of SOS1-mediated nucleotide exchange on RAS. Interestingly, we observed inhibition of downstream MAPK signaling in cancer cells treated with these compounds [7]. We have recently discovered that the inhibition of ERK phosphorylation is achieved by induction of a negative feedback loop that overrides compound-mediated activation of RAS-GTP. In response to compound treatment, phospho ERK phosphorylates S1178 of SOS1. This phosphorylation event inhibits the association between SOS1 and GRB2 and delocalizes SOS1 from the vicinity of RAS, thus preventing RAS-GTP stimulation and downstream ERK phosphorylation [8].
To discover additional chemical matter that targets SOS1, we conducted a high-throughput screen of >160,000 compounds using a fluorescence-based nucleotide exchange assay with BODIPY-GTP. In this screen, we identified compounds with several distinct chemotypes that increase the rate of SOS-catalyzed nucleotide exchange on RAS. These small molecules bind in the same pocket on the CDC25 domain of SOS, adjacent to the RAS-SOS interface. Interestingly, X-Ray crystallographic studies of these ligands bound to the RAS:SOS:RAS complex reveal a binding mode distinct from that of the previously disclosed aminopiperidine indole compounds [7]. Consistent with our previous findings, these newly discovered compounds markedly enhanced the rate of SOS1-mediated nucleotide exchange on RAS in biochemical studies. In addition, these compounds increase the levels of activated GTP-bound RAS in cancer cells and caused a corresponding increase in downstream ERK phosphorylation levels at lower concentrations, and an inhibition of ERK phosphorylation at higher concentrations.
Here, we report on the results of the high-throughput screen and characterize the biological activities of hit compounds. These compounds serve as useful starting points for the discovery of small molecules with improved potency that could be used to target RAS-driven tumors.
2. Results
2.1 Nucleotide Exchange Assay Development
To identify small molecules capable of modulating the RAS-SOS interaction, we designed a high-throughput nucleotide exchange assay. To detect SOS-catalyzed nucleotide exchange on RAS, an environmentally sensitive fluorescent nucleotide analog containing boron-dipyrromethene (BODIPY, ex/em: 485/510 nm) covalently attached to the 2′ or 3′ position of the ribose ring of GTP (BODIPY-GTP) was used. The fluorescence yield from BODIPY-GTP is enhanced on protein binding, thus, the changes in fluorescence between protein-bound nucleotide and free nucleotide in solution can serve as an indicator of nucleotide exchange. While similar exchange assays using fluorescently labeled nucleotide analogs are well described and have been used to study GEF:GTPase interactions for nearly three decades, their use in high-throughput screening has been limited to date [9–11].
For the purposes of screening, the assay was run in an association-dissociation format (Fig. 1A). To conduct the assay, 2 μM SOScat (amino acids 564–1049) and 2 μM BODIPY-GTP were first combined. Test compound was then added. Baseline fluorescence was monitored continuously over these steps, allowing for the detection of fluorescence artifacts at excitation/emission: 485/510 nm. Next, 4 μM purified recombinant GDP-bound K-RASG12D (amino acids 1-169) was added, initiating the nucleotide exchange process. The bound, unlabeled-GDP on RAS was exchanged for BODIPY-GTP during the “association phase,” resulting in increased fluorescence in a time dependent manner (Fig. 1A–B). Finally, addition of excess unlabeled GTP (200 μM) instigated the “dissociation phase”, where the exchange of RAS-bound BODIPY-GTP for unlabeled GTP occurred, causing fluorescence to return to baseline (Fig. 1A–B).
Fig. 1.
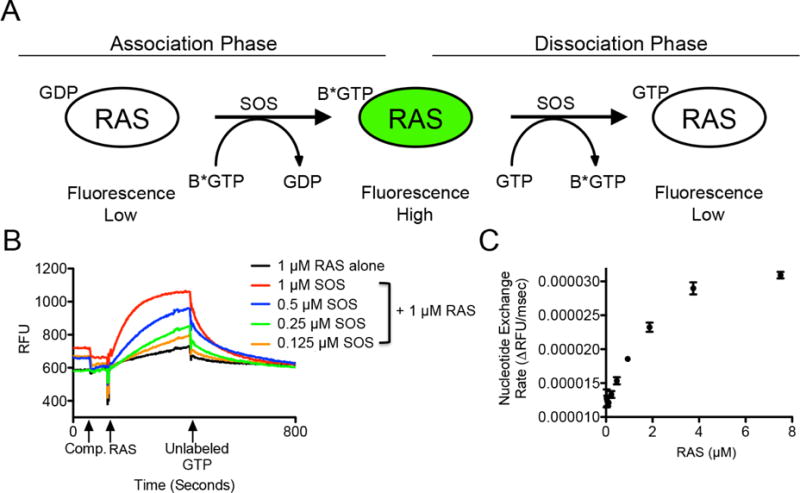
Association-dissociation assay scheme and nucleotide exchange experiments conducted using varying concentrations of RAS and SOS proteins. (A) Schematic representation of SOS-catalyzed nucleotide exchange conducted in an association-dissociation format using BODIPY-GTP (B*GTP). (B) Fluorescence data from the high-throughput screening assay protocol showing nucleotide exchange curves with varying concentrations of SOS, conducted with constant 1 μM RAS. (C) Rate of nucleotide exchange with varying concentrations of RAS (0-8 μM RAS, conducted with constant 1 μM SOS). RFU = Relative fluorescence units.
The association and dissociation of BODIPY-GTP is driven by the relative nucleotide concentrations of each nucleotide, and is catalyzed by SOScat. The rate of nucleotide exchange can be determined as the rate derived from the association curve following the addition of RAS, or as the rate derived from the dissociation curve following the addition of unlabeled-GTP. The association-dissociation format of this assay was designed to permit the identification of compounds that bind to either nucleotide-bound form of RAS. It is known that RAS undergoes a conformational change during the transition from the GDP-bound form to the GTP-bound form [12], and so we originally hypothesized that compounds that altered the unlabeled-GDP to BODIPY-GTP transition during the association phase would bind to RAS-GDP, while compounds that modified the BODIPY-GTP to unlabeled-GTP transition during the dissociation phase would bind to RAS-GTP (Fig. 1A). Alternatively, changes in the rate of nucleotide exchange could also be induced by compounds that bind to SOS or the RAS:SOS complex, as reported previously by our laboratory [7] and AstraZeneca [13], as well as by other groups for alternative GEF:GTPase interactions [14].
Varying the concentration of SOScat revealed that nucleotide exchange could be detected with a range of SOScat concentrations, with higher concentrations of SOScat resulting in faster nucleotide exchange kinetics (Fig. 1B). Consistent with previous reports, increasing the concentration of RAS (while maintaining the concentration of SOScat at 1 μM), increased the rate of nucleotide exchange (Fig. 1C) [7, 15]. On the basis of these studies, final concentrations of 1 μM RAS and 1 μM SOScat were chosen for high-throughput screening since these conditions allowed for the detection of appreciable rates of SOS-catalyzed nucleotide exchange above the intrinsic nucleotide exchange rate of RAS alone (Fig. 1B). Furthermore, these assay conditions have been commonly used in the RAS field, which facilitated comparison to previous studies [7, 16, 17].
2.2 Hit Determination and Compound Validation
The Vanderbilt Compound Collection of >160,000 small molecules was screened to identify compounds that alter the rate of SOS-catalyzed nucleotide exchange on RAS (Supplementary Table S1). To determine the rate of the nucleotide exchange reaction occurring in each well, raw fluorescence data from the dissociation phase was analyzed using a single exponential decay function. Hit compounds were selected based on the Z-score, exchange rate (>±3 standard deviations from the mean of the vehicle control), and the B-score (Supplementary Table S1) [18]. We were interested in identifying any compound that could even weakly alter the RAS-SOS interaction, so two iterative rounds of hit selection were conducted for each plate. In the primary screen 2880 hit compounds were identified, achieving a 1.8% hit rate.
Validation of each hit compound was performed in duplicate using the conditions from the primary screen. Only 10% of the compounds validated upon repeat testing, resulting in 244 confirmed hits. The low rate of validation was likely due to the low threshold for picking hits and the iterative rounds of selection used in the primary screen. Validated hits were then filtered to remove compounds that produced pan-assay interference, unstable molecules, potential irreversible modifiers, and compounds that are frequently active in other screens [19]. After filtering the compounds using these criteria, to prioritize the hits each compound was tested in the nucleotide exchange assay using a broader range of compound concentrations (Supplementary Table S1). Compounds 1–6 represent hit compounds identified in the primary screen that were prioritized for follow-up studies (Fig. 2). It is noteworthy that several of the hit compounds bear significant chemical similarities. For example, structures 1–5 all possess an amine tethered to a lipophilic aromatic moiety. However, the length and nature of both the tether and the aromatic system vary.
Fig. 2.

Representative examples of high-throughput screening hits. Compounds 1–6 were identified in the primary screen and were shown to activate SOS-catalyzed nucleotide exchange. Analogs of the hit compounds (4a, 6a and 6b) were generated upon follow-up.
Initial hit compounds (1–6) and closely related analogs (4a, 6a, and 6b) were ordered as new batches from commercial suppliers or synthesized in-house. The primary screen used unbiased conditions capable of detecting either compound-induced inhibition or compound-induced activation of SOS-mediated nucleotide exchange on RAS. Interestingly, however, we did not identify any validated hits that produced inhibition of nucleotide exchange. Since all of the hit compounds from the primary screen caused activation of exchange, we modified the primary screening conditions and used RAS preloaded with BODIPY-GDP [7] to enhance the detection window of the assay for follow-up studies. The nucleotide exchange rates elicited by compounds 1–6, 4a, 6a and 6b were each compared to our previously reported nucleotide exchange activator (Fig. 3A, (S)-2-amino-N-(1-((5-chloro-1H-indol-3-yl)methyl)piperidin-4-yl)-3-(1H-indol-3-yl)propanamide [Compound 4 from Burns et al., PNAS, 2014 [7]], subsequently referred to as API), which served as a control in all further studies [7]. Nucleotide exchange experiments showed that these compounds varied in both activity, as measured by their half maximal activity (EC50) ranging from 1 μM to >100 μM, and in the maximum rate of SOS-catalyzed nucleotide exchange elicited (Fig. 3). Interestingly, even compounds with similar EC50 values were shown to have distinct differences in the maximum activation rates. Full understanding of this effect remains elusive, but it may have important ramifications in the biological effects produced by the compounds.
Fig. 3.

Validation of hit compounds by nucleotide exchange. (A) Previously published aminopiperidine indole compound (API); Compound-mediated changes in fluorescence elicited through nucleotide exchange by the API compound (B) and compound 6a (C). A 10-point, 2-fold dilution of compound was used, and the maximum concentration of compound was 100 μM. Each black line represents nucleotide exchange elicited by a different concentration of compound. Nucleotide exchange reactions conducted using RAS-alone and RAS+SOS are shown in blue and red, respectively. Curves shown are from representative nucleotide exchange experiments. RFU = Relative fluorescence units. (D) Relative percentage activation of SOS-catalyzed nucleotide exchange of the API compound and compounds 6a, 4, 4a and 6. Fluorescence data are plotted as a function of compound concentration, normalized from 0 to 100 between the rate of exchange detected for RAS+SOS alone, and the maximal rate of exchange elicited by RAS+SOS in the presence of the API compound.
2.3 X-Ray crystallography shows that compounds bind to the RAS:SOS:RAS complex
X-Ray structures of each of the four ligands that elicited the lowest EC50 values in the nucleotide exchange assay (Table 1 and Supplementary Table S2, PDB entries: 5WFO, 5WFP, 5WFQ, 5WFR) bound to the RAS:SOS:RAS complex were obtained. As exemplified by compound 6, the co-crystal structures reveal that these compounds bind to the same hydrophobic pocket on the CDC25 domain of SOS1 as our previously reported aminopiperidine indole compounds (Fig. 4A and Supplementary Table S2) [7]. Upon RAS:SOS:RAS complex formation, the Switch II region of RAS occupies a position adjacent to the CDC25 domain of SOS. We previously showed that the binding pocket is formed by two alpha helices linked by a helical turn containing P894, within the SOS catalytic domain [7, 20]. The anterior wall of the pocket is formed by Y884 and N879 that directly link the compound to the Switch II region of RAS [7].
Table 1.
Half maximal efficacy (EC50) and the maximum rate of nucleotide exchange elicited by compounds 1–6b and API. Experiments were performed in duplicate.
| Comparison of compound activity
| ||||
|---|---|---|---|---|
| EC50 | Relative rate of nucleotide exchange at 100 μM* | |||
| Compound | n=1 | n=2 | n=1 | n=2 |
| 1 | 55.8 | >100 | 33.1 | 49.9 |
| 2 | >100 | 45.3 | 40.9 | 49.3 |
| 3 | >100 | >100 | 21.4 | 26.3 |
| 4 | 58.0 | 62.6 | 45.1 | 56.6 |
| 4a | 8.7 | 10.4 | 70.1 | 68.1 |
| 5 | NA | NA | NA | NA |
| 6 | 12.9 | 13.3 | 27.3 | 45.3 |
| 6a | 4.5 | 2.9 | 35.4 | 36.6 |
| 6b | 1.5 | 3.0 | 8.2 | 24.4 |
| API | 13.8 | 11.7 | 100 | 100 |
Relative rate of nucleotide exchange normalized between the rate of SOS-catalyzed nucleotide exchange and the maximal rate of nucleotide exchange elicited by SOS in the presence of 100 μM of a previously reported compound (API, Fig. 3A).
Fig. 4.

Structural comparison of high-throughput screening-derived nucleotide exchange activator hit compounds and previously reported aminopiperidine indoles. (A) Compound 6 in complex with the RAS:SOS:RAS complex. (B) A comparison of binding modes of high-throughput screening hit compounds 6 (dark green), 6a (gray), 6b (yellow), and 4a (orange; top) in contrast to a comparison of the binding mode of compound 6 (dark green) versus the binding mode of the previously reported API2 (cyan; PDB: 4NYI; bottom). (C) Co-crystal structures of compound 6. (D) Co-crystal structure of API2 highlighting movement by side chain of amino acid F890 (orange). Arrows in (C) and (D) indicate the hydrophobic portion of the pocket located at the helical turn created by residue P894.
With this understanding of the binding pocket, here we show that the 4-fluorophenyl substituent of compound 6 projects towards the hydrophobic pocket adjacent to H905 on SOS, while the 6-chloroquinoline moiety rests between the side chains of residues Y884 and F890 on SOS, and the cyclohexyl portion is oriented towards the solvent (Fig. 4A). Comparison of the binding mode of compound 6 (dark green) with the binding modes of closely related analogs 6a (gray) and 6b (yellow) and compound 4a (orange) reveals that these ligands bind in a conserved manner, with one hydrophobic ring occupying the pocket adjacent to H905 and an additional ring located between residues Y884 and F890, with slight variations as shown (Fig. 4B, top). In addition, the basic amine substituent of compound 4a (orange) is oriented towards the solvent (Fig. 4B, top).
When overlaid, compound 6 and the previously reported (S)-2-amino-3-(1H-indol-3-yl)-N-(1-((5-methyl-1H-indol-3-yl)methyl)piperidin-4-yl)propanamide (Compound 3 from Burns et al., PNAS, 2014 [7], subsequently referred to as API2) bind to the same pocket on SOS, but with mutually exclusive binding modes (Fig. 4B, bottom). The 6-chloroquinoline substituent of compound 6 occupies a hydrophobic pocket underneath residue F890 on SOS. The pocket is created by the rotation of F890 upwards and out of the pocket (Fig. 4C). The ‘upwards’ projected conformation expands the hydrophobic part of the pocket at the bottom while reducing the space at the top of the pocket around a hydrophobic shelf located at the helical turn, created by P894 (Fig. 4C, arrow). In the previously described binding mode, part of API2 [7] binds to this shelf, which is accessible when the F890 side chain adopted a ‘downwards’ conformation (Fig. 4D, arrow). Consistent with our findings, recent reports have also identified the flexibility of the F890 residue in this pocket [13].
2.4 Compounds can induce biphasic changes in RAS-GTP and phospho ERK levels in cancer cells
To assess the ability of these compounds to alter RAS signaling in cells, endogenous RAS-GTP levels and phospho ERK1/2T202/Y204 levels were measured in response to compound treatment. An increase in RAS-GTP levels was observed after treatment with the API compound and compound 4a relative to the DMSO control (Fig. 5), indicating that these compounds can activate nucleotide exchange in cells expressing full length SOS1 and RAS proteins. Treatment with compounds 4, 6 and 6a did not cause an increase in RAS-GTP levels in cells. Interestingly, these findings are consistent with the maximal rate of nucleotide exchange elicited by each compound, but are not related to EC50 of nucleotide exchange; the API compound caused the greatest increase in the rate of nucleotide exchange at 100 μM (100%), followed by compounds 4a (69.1%), 4 (50.9%), 6 (36.3%), and 6a (36.0%) (Average ‘Relative Rate of Nucleotide Exchange at 100 μM’ values from Table 1).
Fig. 5.

Assessment of RAS-GTP and phospho ERK levels in response to compound treatment in cancer cells. RAS-GTP and corresponding phospho ERK1/2T202/Y204 levels from HeLa cells that were treated for 30 minutes with up to 200 μM compound. Each experiment was conducted in duplicate.
Consistent with our previous findings [7, 8], compound-mediated activation of RAS resulted in a corresponding increase in phospho ERK1/2T202/Y204 levels (Fig. 5A). At lower concentrations, treatment with API and compound 4a led to an increase in RAS-GTP levels, and in turn resulted in the induction of phospho ERK levels in cells. Importantly, inhibition of phospho ERK levels was observed after treatment at higher concentrations of those compounds also capable of eliciting the highest degree of nucleotide exchange in vitro; compound 4a, and API. These findings suggest that the degree of nucleotide exchange induction by a compound in biochemical studies correlates with the degree of RAS-GTP induction in cells.
3. Discussion
We conducted a high-throughput screen measuring SOS-catalyzed nucleotide exchange on RAS, which resulted in the discovery of multiple chemical series that bind to a single site on the CDC25 domain of SOS1 and activate SOS-mediated nucleotide exchange. These compounds bind to the same pocket as our previously reported compounds with a different binding mode, but elicit similar biochemical and cellular effects. Treatment of cells with either the API compound or compound 4a caused an increase in RAS-GTP and induced biphasic changes in phospho ERK levels, characterized by an increase in ERK phosphorylation at lower concentrations of compound and an inhibition of ERK phosphorylation at higher concentrations of compound. Interestingly, we observed this phenotype with the API compound and compound 4a only, which we hypothesize is due to their capability to elicit higher degrees of nucleotide exchange induction in biochemical assays. If all compounds work by the same biological mechanism, we anticipate that compounds that activate nucleotide exchange to a greater degree than the API compound may also cause more potent inhibition of phospho ERK signaling. Mechanistically, this may be achieved through a more robust and rapid activation of the negative feedback loop that inhibits SOS-mediated activation of RAS-GTP [8]. We also suggest that a certain threshold of activation must be met in biochemical assays before RAS-GTP induction is observed in cells, as exemplified by compounds 6 and 6a.
In the context of oncogenic RAS signaling, the use of small molecule agonists as therapeutic agents may seem counterintuitive. However, it is known that overexpression of RAS can result in cancer cell death [21]. In addition, the anti-proliferative effects of wild-type RAS overexpression are significantly less than the effects of mutant G12V RAS overexpression [21], and overexpression of mutant G12V RAS elicits markedly higher levels of RAS-GTP in cancer cells than the overexpression of wild-type RAS [22]. Therefore, we hypothesize that the compounds described here may elicit desirable anti-cancer effects if they rapidly induce RAS activation to an intolerably high threshold, thus resulting in stimulation of phospho ERK-mediated negative feedback that subsequently inhibits RAS-GTP and associated downstream signaling events [8]. It will be interesting to test this hypothesis with the discovery of improved molecules, from multiple chemical series, that elicit enhanced induction of nucleotide exchange on RAS in both biochemical and cellular contexts.
We have discovered structurally diverse ligands that bind to a pocket on the RAS:SOS:RAS complex and represent useful starting points for the discovery of more potent compounds. Indeed, the compounds and co-crystal structures presented here have improved our understanding of the flexibility of the amino acid residues within this pocket, highlighted by the observed movement of F890. Overall, these compounds provide us with the unique opportunity to better understand the biological functions of SOS and RAS in cells, and may aid in the discovery of small molecules to treat RAS-driven tumors.
4. Materials and Methods
4.1 Protein Purification
Recombinantly expressed K-RASG12D (referred to as RAS, aa 1-169) and human SOS1 (SOScat, aa 564-1049) were purified as described previously [23]. K-RASG12D/C118S was cloned into a pDEST-HisMBP vector (pDEST-HisMBP and TEV protease were a gift from Dr. David Waugh, NCI) and the protein was expressed in the Rosetta 2 (DE3) E. coli strain. A Ni-IDA (ProBond, Invitrogen) column was used to purify the His-tagged protein. Subsequently, the HisMBP tag was cleaved using TEV protease. An additional Ni-NTA column was used and the RAS protein was collected in the flow-through. H-RAS was expressed and purified in a similar fashion for X-Ray crystallography. SOScat was cloned into a pDEST-17 Gateway vector carrying an N-terminal His6 tag for purification. It was expressed in BL21-RIL E. coli at 18°C for 7 hours followed by purification on a Ni-IDA column.
Additional proteins and purification steps were required for X-Ray crystallographic studies. H-RAS was used for X-Ray crystallography and purified according the protocol described above for K-RASG12D. H-RAS was further purified using a Superdex 75 column. The same purification scheme was used for H-RASY64A, which was used to form the complex as described previously [17]. For structure determination, the terminal His6 tag on SOScat was cleaved using TEV protease and the mixture was applied to a Ni-NTA column with the SOScat protein being collected in the flow through. SOScat without the His6 tag was then applied to an HiTrap Q column (5 mL), followed by gel filtration chromatography.
Generation of H-RASY64A bound to the non-hydrolyzable GTP analog GppNHp was achieved by incubating concentrated protein with 10 mM EDTA for 30 minutes at 37°C. EDTA was then extracted by buffer exchange and 2.5 mM GppNHp was added along with apyrase (5 μL/mL; Sigma) to digest the released GDP. The mixture was incubated for 2 hours at 37°C, then 5 mM MgCl2 and an additional 2 mM GppNHp were added. GppNHp-bound H-RASY64A was finally purified using a Superdex 75 column.
The H-RAS:SOScat:H-RASY64A(GppNHp) complex was prepared as described previously [7]. Purified H-RAS and SOScat were exchanged into a buffer containing 25 mM Tris·HCl (pH 7.5), 50 mM NaCl, and 2 mM DTT. First, the SOScat:RAS binary complex was generated by incubating excess H-RAS (4X) at 4°C overnight with SOScat and EDTA. The binary complex was then purified using a Superdex 200 column. Concentrated binary complex was incubated with excess H-RASY64AGppNHp (4X) at 4°C for 2 hours. Subsequently, the final H-RAS:SOScat:H-RASY64A(GppHNp) was isolated using a Superdex 200 column.
4.2 Nucleotide Exchange Assays
For high-throughput screening, nucleotide exchange assays were conducted using BODIPY-GTP (Life Technologies; excitation: 485, emission: 510) in a buffer containing 25 mM Tris (pH 7.5), 50 mM NaCl, and 20 μM MgCl2. Baseline fluorescence of a mixture of SOS and BODIPY-GTP was recorded for 10 seconds followed by addition of compound. A second addition of RAS was performed at 120 seconds for the association phase, followed by a third addition of unlabeled GTP at 7 minutes. Nucleotide exchange was then monitored as a decrease in fluorescence over time. Final reactions contained 1 μM BODIPY-GTP, 1 μM RAS, 200 μM unlabeled GTP, and 1 μM SOScat.
Changes in fluorescence were monitored using a Hamamatsu FDSS 6000 with readings conducted every 3 seconds for 12 minutes. Assays were conducted using 50 μL final volume in a 384-well clear bottom, black Aurora microplate. Raw fluorescence data was fit to a single exponential decay function using XLfit (IDBS) software. Details of high-throughput screening parameters are provided in Supplementary Table S1. For concentration-response curves, derived rates were plotted as a function of compound concentration and fit using a four-parameter dose-response curve (Prism).
Automation of the high-throughput screen was accomplished with the support of Vanderbilt Institute of Chemical Biology’s High-throughput Screening Core. Compounds were pipetted into 384 Greiner addition plates using an Echo Liquid Handler. The SOS/BODIPY-GTP mixture was pipetted into 384 Aurora microplates using a Bravo Pipettor. All automation was controlled using Thermo-CRS Polara scheduling software and a Thermo-CRS F3 articulated robot arm. Robotic accessories included a barcode reader, re-grip station, de-lidder, and plate carousel. A Velocity11 VSpin was used for automated centrifugation. Additions conducted during screening were accomplished using liquid handling capabilities of the Hamamatsu FDSS.
After resynthesizing or reordering hit compounds, additional nucleotide exchange experiments were conducted using BODIPY-GDP–loaded RAS in a buffer containing 25 mM Tris (pH 7.5), 50 mM NaCl, and 1 mM MgCl2. For these experiments compound was added after 10 seconds, unlabeled GTP after 120 seconds, and a single exponential decay function was used to determine the rate of nucleotide exchange. Fluorescence was monitored for 30 minutes. Derived rates were plotted as a function of compound concentration and fit using a four-parameter dose-response curve (Prism) to determine the half maximal efficacy and maximum rate of nucleotide exchange elicited. Nucleotide exchange rates were normalized between the rate a SOS-catalyzed exchange in the absence of compound (equal to 0) and the maximum rate of exchange elicited by the control compound run on each plate (equal to 100) as shown in Figure 3D and Table 1.
4.3 Reordering Compounds
High-throughput screening hits, with the exception of compounds 4 and 4a, were reordered as dry powders in 5 milligram quantities from commercial suppliers. Compounds were suspended at a concentration of 20 mM in DMSO and stored at −20°C.
4.4 Organic Synthesis
NMR spectra were recorded on a Varian Inova 400 (400-MHz NMR spectrometer) located in the small molecule NMR facility at Vanderbilt University. 1H chemical shifts (δ) are reported in parts per million (ppm) using residual protonated solvent as an internal reference (δ 7.26 for CHCl3). Data are reported as follows: chemical shift, multiplicity, coupling constants (Hz), and integration. Apparent splitting patterns are designated as singlet (s), doublet (d), triplet (t), quartet (q), multiplet (m), broad (br), and overlapping (ovlp). 13C chemical shifts (δ) are reported in parts per million (ppm) using residual protonated solvent as an internal reference (δ 77.36 for CHCl3). Low-resolution mass spectra were obtained on an Agilent 1200 LCMS with electrospray ionization. High-resolution mass spectra were recorded on a Waters Qtof API-US plus Acquity system. Analytical TLC was performed on 250 mM silica gel 60 F254 plates. Analytical HPLC was performed on an Agilent 1200 analytical LCMS with UV detection at 214 nm and 254 nm along with evaporative light scattering detector (ELSD) detection. Flash column chromatography was performed on silica gel (230–400 mesh; Merck) or using automated silica gel chromatography (100 sg Combiflash; Isco, Inc.).
4.5 Compound Synthesis

4.5.1 N-(3,3-diphenylpropyl)-1-propylpiperidin-4-amine (Compound 4)
1-bromo-3,3-diphenyl propane (150 mg, 0.545 mmol) and 1-propylpiperidin-4-amine (163 mg, 1.14 mmol, 2.1 eq) were dissolved in acetonitrile (5 mL) at room temperature in a reaction flask equipped with a stir bar. Potassium carbonate (75 mg, 0.545 mmol, 1 eq) was added to the reaction mixture. The reaction was heated at 65°C for 18 hours or until the starting material had been completely consumed, as judged by LCMS. The reaction mixture was cooled to room temperature and concentrated in vacuo. The residue was dissolved in dichloromethane and then sequentially washed with water and brine. The organic layer was dried over magnesium sulfate and concentrated to afford a crude white solid, which was purified by column chromatography to produce a pure white solid (120 mg, 65% yield). 1H NMR (400 MHz, MeOD) δ 7.30 (ovlp, 8H), 7.20 (ovlp, 2H), 4.07 (t, J = 8.0 Hz, 1H), 3.67 (ovlp bs, 2H), 3.40 (m, 1H), 3.02 (ovlp, 6H), 2.47 (m, 2H), 2.29 (ovlp bs, 2H), 1.93 (bs, 2H), 1.74 (m, 2H), 1.00 (t, J = 7.3 Hz, 3H). MS (ESI) [M+H]+ m/z = 337.30. LCMS Ret time (UV 214/254): 1.065.

4.5.2 N-(3,3-diphenylpropyl)piperidin-4-amine (Compound 4a)
1-bromo-3,3-diphenyl propane (150 mg, 0.545 mmol) and tert-butyl 4-aminopiperidine-1-caroxylate (230 mg, 1.14 mmol, 2.1 eq) were dissolved in acetonitrile (5 mL) at room temperature in a reaction flask equipped with a stir bar. Potassium carbonate (75 mg, 0.545 mmol, 1 eq) was added to the reaction mixture. The reaction was heated at 65°C for 18 hours or until the starting material had been completely consumed, as judged by LCMS. The reaction mixture was cooled to room temperature and concentrated in vacuo. The residue was dissolved in dichloromethane and then washed sequentially with water and brine. The organic layer was dried over magnesium sulfate and concentrated to afford a crude white solid. The solid was then dissolved in dichloromethane (2 mL) and TFA (1 mL) was added to the vial. Upon deprotection of the Boc group, the solvents were removed under vacuum and the crude material was purified by reverse phase preparative HPLC. After evaporation of the collected fractions, the compound was obtained as a white solid as its corresponding trifluoroacetate salt (95 mg, 60% yield). 1H NMR (400 MHz, MeOD) δ 7.33 (ovlp, 8H), 7.23 (m, 2H), 4.09 (t, J = 7.9 Hz, 1H), 3.53 (ovlp bs, 2H), 3.40 (m, 1H), 3.04 (ovlp, 4H), 2.48 (q, J = 8.0 Hz, 2H), 2.27 (ovlp bs, 2H), 1.81 (bs, 2H). MS (ESI) [M+H]+ m/z = 295.30. LCMS Ret time (UV 214/254): 1.018.
4.6 Protein Crystallization
Co-crystal structures were obtained as previously described using the H-RASWT:SOScat:H-RASY64AGppNHp complex [7]. This complex was exchanged into a buffer containing 25 mM Tris, 50 mM NaCl, and 2 mM DTT (pH 7.5) and concentrated to 25 mg/mL. Co-complexes with ligands were prepared by adding the ligand to a final concentration ranging between 2 mM and 5 mM. Crystallization experiments were performed with a Mosquito crystallization robot (TTP Labtech) or manually by using the hanging-drop vapor diffusion method at 4°C. Co-crystals of compounds 4a, 6, 6a, and 6b were obtained under conditions containing 0.1 M sodium acetate and 2 M sodium formate at pH 4.0. Crystals were cryo-protected with 20% glycerol and flash frozen in liquid nitrogen.
4.7 X-Ray Data Collection, Structure Solution, and Refinement
A synchrotron radiation (beamline 21 LS-CAT; APS) was used for data collection. Data were processed with HKL-2000 [24], and structures were determined by molecular replacement using the coordinates of H-RAS:SOScat:H-RASY64A:GppNHp (PDB entries 1NVV and 1NVX). Program packages CCP4 [25] and Phenix [26] were used for phasing and refinement. Model fitting was performed with COOT [27]. Data collection and restrained refinement statistics are summarized in Supplementary Table S2. The refined models were validated with the MolProbity program implemented in Phenix.
4.8 Cellular Experiments
HeLa cells were obtained from the ATCC (CCL-2) and were cultured in DMEM supplemented with 10% (v/v) FBS. Cells were authenticated by STR profiling and were negative for mycoplasma (Genetica). Cells were plated to achieve 80% confluency after 24 hours, and were treated with DMSO vehicle control or compound for 30 minutes as indicated. Levels of RAS-GTP were determined using a RAS binding domain pull-down assay according to the manufacturer’s instructions (Thermo Fisher Scientific #16117). Lysates were resolved by SDS-PAGE and transferred onto Immobilon-FL PVDF membranes (Millipore). Membranes were probed with primary antibodies as indicated, incubated with labeled secondary antibody and scanned using an Odyssey imager (LiCor). Primary antibodies targeting pan-RAS (#3339), ERK1/2 (#9102) and phospho ERK1/2T202/Y204 (#9106) were obtained from Cell Signaling.
Supplementary Material
Table S1. Parameters for the small molecule screen.
Table S2. X-Ray data collection and refinement statistics.
Highlights.
Measured nucleotide exchange rate with a high throughput fluorescence-based assay
Discovered structurally diverse molecules that activate nucleotide exchange
Used X-Ray structures to determine that molecules bind to the CDC25 domain of SOS1
Identified that molecules modulate RAS-GTP and phospho ERK levels in cancer cells
Acknowledgments
Funding to support this work came from the Ann Melly Scholarship in Oncology (M.C.B.), Public Health Service Award T32 GM07347 from the National Institute of General Medical Studies for the Vanderbilt Medical-Scientist Training Program (M.C.B.), a National Cancer Institute Specialized Program of Research Excellence award in gastrointestinal cancer [grant number 5P50A095103-09], R. J. Coffey), and a Research Investigator Award from the Lustgarten Foundation (S.W.F.). Use of the Advanced Photon Source, an Office of Science User Facility operated for the US Department of Energy Office of Science by the Argonne National Laboratory, was supported by US Department of Energy [Contract No. DE-AC02-06CH11357]. Use of the Life Sciences Collaborative Access Team Sector 21 was supported by the Michigan Economic Development Corporation and Michigan Technology Tri- Corridor Grant [grant number 085P1000817]. We would like to acknowledge Dr. David Waugh in the Protein Engineering Section at the National Cancer Institute, Frederick, MD for the protein expression vector and TEV protease. We would like to thank the Vanderbilt High-Throughput Screening (HTS) Core, in which some of these experiments were performed and whose staff including C. David Weaver, Paige Vinson, Daniel Dorsett, Chris Farmer, and Michelle Lewis provided invaluable assistance. The HTS Core receives support from the Vanderbilt Institute of Chemical Biology and the Vanderbilt Ingram Center [grant number P30 CA68485].
Footnotes
Publisher's Disclaimer: This is a PDF file of an unedited manuscript that has been accepted for publication. As a service to our customers we are providing this early version of the manuscript. The manuscript will undergo copyediting, typesetting, and review of the resulting proof before it is published in its final citable form. Please note that during the production process errors may be discovered which could affect the content, and all legal disclaimers that apply to the journal pertain.
Conflict of Interest Statement: RAS activator compounds have been licensed to Boehringer Ingelheim.
References
- 1.Bos JL. ras Oncogenes in human cancer: a review. Cancer Res. 1989;49:4682–4689. [PubMed] [Google Scholar]
- 2.Prior IA, Lewis PD, Mattos C. A comprehensive survey of Ras mutations in cancer. Cancer Res. 2012;72:2457–2467. doi: 10.1158/0008-5472.CAN-11-2612. [DOI] [PMC free article] [PubMed] [Google Scholar]
- 3.Pylayeva-Gupta Y, Grabocka E, Bar-Sagi D. RAS oncogenes: weaving a tumorigenic web. Nat Rev Cancer. 2011;11:761–774. doi: 10.1038/nrc3106. [DOI] [PMC free article] [PubMed] [Google Scholar]
- 4.Chin L, Tam A, Pomerantz J, Wong M, Holash J, Bardeesy N, Shen Q, O’Hagan R, Pantginis J, Zhou H, Horner JW, 2nd, Cordon-Cardo C, Yancopoulos GD, DePinho RA. Essential role for oncogenic Ras in tumour maintenance. Nature. 1999;400:468–472. doi: 10.1038/22788. [DOI] [PubMed] [Google Scholar]
- 5.Podsypanina K, Politi K, Beverly LJ, Varmus HE. Oncogene cooperation in tumor maintenance and tumor recurrence in mouse mammary tumors induced by Myc and mutant Kras. Proc Natl Acad Sci. 2008;105:5242–5247. doi: 10.1073/pnas.0801197105. [DOI] [PMC free article] [PubMed] [Google Scholar]
- 6.Konstantinopoulos PA, Karamouzis MV, Papavassiliou AG. Post-translational modifications and regulation of the RAS superfamily of GTPases as anticancer targets. Nat Rev Drug Discov. 2007;6:541–555. doi: 10.1038/nrd2221. [DOI] [PubMed] [Google Scholar]
- 7.Burns MC, Sun Q, Daniels RN, Camper D, Kennedy JP, Phan J, Olejniczak ET, Lee T, Waterson AG, Rossanese OW, Fesik SW. Approach for targeting Ras with small molecules that activate SOS-mediated nucleotide exchange. Proc Natl Acad Sci. 2014;111:3401–3406. doi: 10.1073/pnas.1315798111. [DOI] [PMC free article] [PubMed] [Google Scholar]
- 8.Howes JE, Akan DT, Burns MC, Rossanese OW, Waterson AG, Fesik SW. Small molecule-mediated activation of RAS elicits biphasic modulation of phospho ERK levels that are regulated through negative feedback on SOS1. Mol Cancer Ther. doi: 10.1158/1535-7163.MCT-17-0666. (In press) [DOI] [PubMed] [Google Scholar]
- 9.Lenzen C, Cool RH, Prinz H, Kuhlmann J, Wittinghofer A. Kinetic analysis by fluorescence of the interaction between Ras and the catalytic domain of the guanine nucleotide exchange factor Cdc25Mm. Biochemistry. 1998;37:7420–7430. doi: 10.1021/bi972621j. [DOI] [PubMed] [Google Scholar]
- 10.Rojas RJ, Kimple RJ, Rossman KL, Siderovski DP, Sondek J. Established and emerging fluorescence-based assays for G-protein function: Ras-superfamily GTPases. Comb Chem High Throughput Screen. 2003;6:409–418. doi: 10.2174/138620703106298509. [DOI] [PubMed] [Google Scholar]
- 11.Zeeh JC, Antonny B, Cherfils J, Zeghouf M. In vitro assays to characterize inhibitors of the activation of small G proteins by their guanine nucleotide exchange factors. Methods Enzymol. 2008;438:41–56. doi: 10.1016/S0076-6879(07)38004-X. [DOI] [PubMed] [Google Scholar]
- 12.Hall BE, Bar-Sagi D, Nassar N. The structural basis for the transition from Ras-GTP to Ras-GDP. Proc Natl Acad Sci. 2002;99:12138–12142. doi: 10.1073/pnas.192453199. [DOI] [PMC free article] [PubMed] [Google Scholar]
- 13.Winter JJ, Anderson M, Blades K, Brassington C, Breeze AL, Chresta C, Embrey K, Fairley G, Faulder P, Finlay MR, Kettle JG, Nowak T, Overman R, Patel SJ, Perkins P, Spadola L, Tart J, Tucker JA, Wrigley G. Small molecule binding sites on the Ras:SOS complex can be exploited for inhibition of Ras activation. J Med Chem. 2015;58:2265–2274. doi: 10.1021/jm501660t. [DOI] [PubMed] [Google Scholar]
- 14.Mossessova E, Corpina RA, Goldberg J. Crystal structure of ARF1*Sec7 complexed with Brefeldin A and its implications for the guanine nucleotide exchange mechanism. Mol Cell. 2003;12:1403–1411. doi: 10.1016/s1097-2765(03)00475-1. [DOI] [PubMed] [Google Scholar]
- 15.Lenzen C, Cool RH, Wittinghofer A. Analysis of intrinsic and CDC25-stimulated guanine nucleotide exchange of p21ras-nucleotide complexes by fluorescence measurements. Methods Enzymol. 1995;255:95–109. doi: 10.1016/s0076-6879(95)55012-7. [DOI] [PubMed] [Google Scholar]
- 16.Sondermann H, Soisson SM, Boykevisch S, Yang SS, Bar-Sagi D, Kuriyan J. Structural analysis of autoinhibition in the Ras activator Son of sevenless. Cell. 2004;119:393–405. doi: 10.1016/j.cell.2004.10.005. [DOI] [PubMed] [Google Scholar]
- 17.Margarit SM, Sondermann H, Hall BE, Nagar B, Hoelz A, Pirruccello M, Bar-Sagi D, Kuriyan J. Structural evidence for feedback activation by Ras.GTP of the Ras-specific nucleotide exchange factor SOS. Cell. 2003;112:685–695. doi: 10.1016/s0092-8674(03)00149-1. [DOI] [PubMed] [Google Scholar]
- 18.Brideau C, Gunter B, Pikounis B, Liaw A. Improved statistical methods for hit selection in high-throughput screening. J Biomol Screen. 2003;8:634–647. doi: 10.1177/1087057103258285. [DOI] [PubMed] [Google Scholar]
- 19.Baell JB, Holloway GA. New substructure filters for removal of pan assay interference compounds (PAINS) from screening libraries and for their exclusion in bioassays. J Med Chem. 2010;53:2719–2740. doi: 10.1021/jm901137j. [DOI] [PubMed] [Google Scholar]
- 20.Boriack-Sjodin PA, Margarit SM, Bar-Sagi D, Kuriyan J. The structural basis of the activation of Ras by Sos. Nature. 1998;394:337–343. doi: 10.1038/28548. [DOI] [PubMed] [Google Scholar]
- 21.Chi S, Kitanaka C, Noguchi K, Mochizuki T, Nagashima Y, Shirouzu M, Fujita H, Yoshida M, Chen W, Asai A, Himeno M, Yokoyama S, Kuchino Y. Oncogenic Ras triggers cell suicide through the activation of a caspase-independent cell death program in human cancer cells. Oncogene. 1999;18:2281–2290. doi: 10.1038/sj.onc.1202538. [DOI] [PubMed] [Google Scholar]
- 22.Recktenwald CV, Mendler S, Lichtenfels R, Kellner R, Seliger B. Influence of Ki-ras-driven oncogenic transformation on the protein network of murine fibroblasts. Proteomics. 2007;7:385–398. doi: 10.1002/pmic.200600506. [DOI] [PubMed] [Google Scholar]
- 23.Sun Q, Burke JP, Phan J, Burns MC, Olejniczak ET, Waterson AG, Lee T, Rossanese OW, Fesik SW. Discovery of small molecules that bind to K-Ras and inhibit Sos-mediated activation. Angew Chem Int Ed Engl. 2012;51:6140–6143. doi: 10.1002/anie.201201358. [DOI] [PMC free article] [PubMed] [Google Scholar]
- 24.Otwinowski Z, Minor W. Processing of X-ray diffraction data collected in oscillation mode. Methods Enzymol. 1997;276:307–326. doi: 10.1016/S0076-6879(97)76066-X. [DOI] [PubMed] [Google Scholar]
- 25.N. Collaborative Computational Project. The CCP4 suite: programs for protein crystallography. Acta Crystallogr Sect D. 1994;50:760–763. doi: 10.1107/S0907444994003112. [DOI] [PubMed] [Google Scholar]
- 26.Adams PD, Grosse-Kunstleve RW, Hung LW, Ioerger TR, McCoy AJ, Moriarty NW, Read RJ, Sacchettini JC, Sauter NK, Terwilliger TC. PHENIX: building new software for automated crystallographic structure determination. Acta Crystallogr Sect D. 2002;58:1948–1954. doi: 10.1107/s0907444902016657. [DOI] [PubMed] [Google Scholar]
- 27.Emsley P, Lohkamp B, Scott WG, Cowtan K. Features and development of Coot. Acta Crystallogr Sect D. 2010;66:486–501. doi: 10.1107/S0907444910007493. [DOI] [PMC free article] [PubMed] [Google Scholar]
Associated Data
This section collects any data citations, data availability statements, or supplementary materials included in this article.
Supplementary Materials
Table S1. Parameters for the small molecule screen.
Table S2. X-Ray data collection and refinement statistics.