
Figure 2. Non-Smad TGF-β signaling is dominant during TH9 cell differentiation.
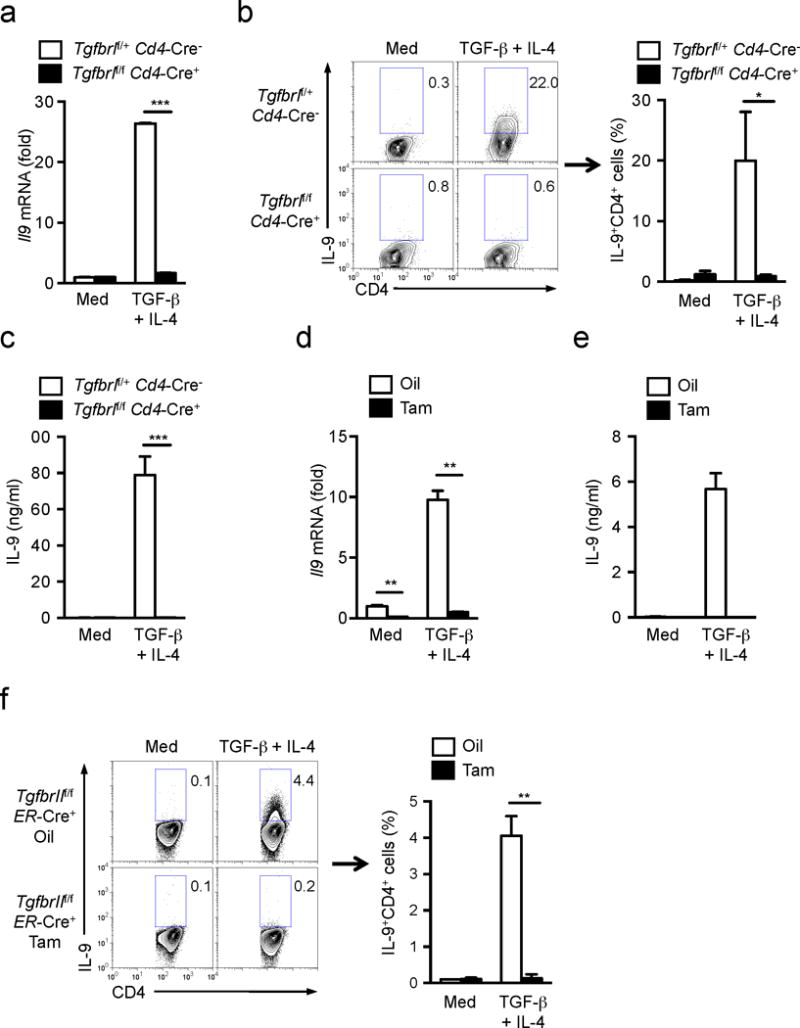
(a) mRNA expression of Il9 in naïve T cells from Tgfbr1f/fCd4-Cre+ and Tgfbr1f/+Cd4-Cre− mice cultured with anti-CD3+CD28 with or without TGF-β1 plus IL-4 for 24h. (b) Intracellular staining of IL-9 protein in CD4+ T cells differentiated as described in a for 72h. Left; Representative of three indepednent experiments. Right; Frequency of IL-9+ TH9 cells from three independent experiments. (c) IL-9 production in culture media of b was determined by ELISA. (d) mRNA expression of Il9 in naïve T cells from TgfbrIIf/fER-Cre+ mice that had been injected with oil or tamoxifen i.p. for consecutive 5 days cultured with anti-CD3+CD28 with or without TGF-β1 plus IL-4 for 24h. (e) IL-9 production in culture media of CD4+ T cells differentiated as described in d was determined by ELISA. (f) Intracellular staining of IL-9 protein in CD4+ T cells differentiated as in e for 72h. Left; Representative of two experiments. Right; Frequency of IL-9+ TH9 cells from two experiments. Data are representative of two (d, e, f(left)) or three (a, b(left), c) independent experiments or are pooled from two (f(right)) or three (b(right)) experiments. Error bars represent mean ± SD. *p<0.05, **p<0.01, ***p<0.001 (Student’s t-test,).