
Figure 4. E2A and GATA-3 are enriched at Il9 promoter region to promote IL-9 expression.
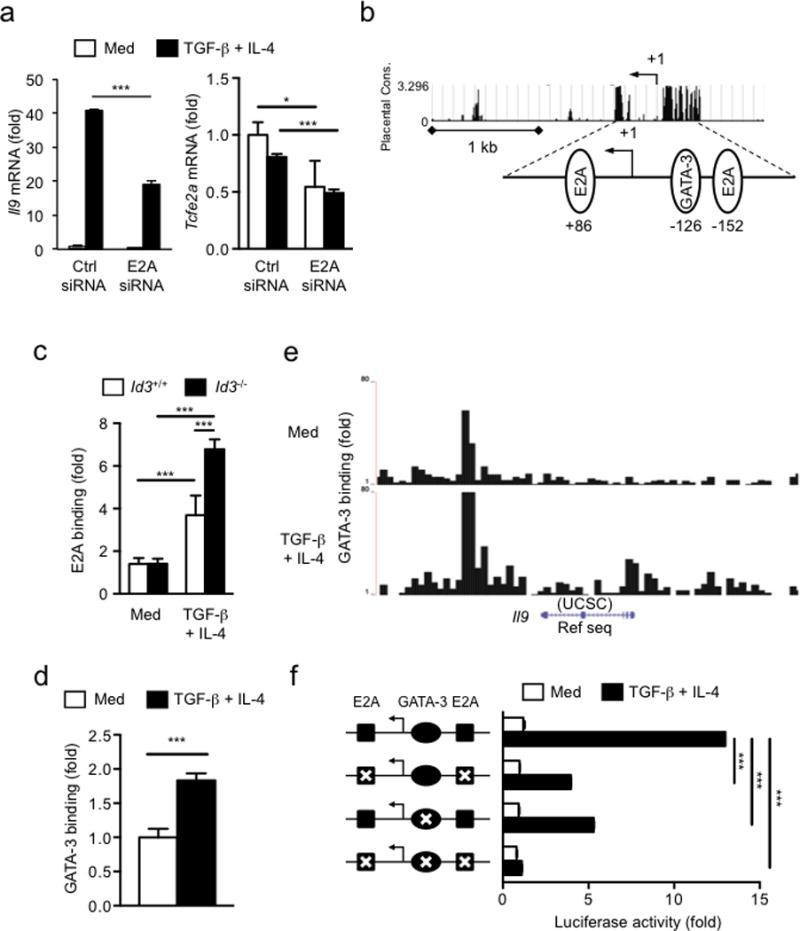
(a), Il9 (left panel) and Tcfe2a (E2A) (right panel) mRNA expression in wild-type naive CD4+ T cells treated with E2A-specific or control siRNA, assessed after stimulation with anti-CD3+CD28 with or without TGF-β1 plus IL-4 for 24h and presented relative to Hprt expression. (b) Genomatix Matinspector analysis of E-protein binding sites (E-boxes) and GATA-3 binding site at the Il9 promoter. (c) ChIP-coupled quantitative PCR analysis of the enrichment of E2A at Il9 promoter region in naive CD4+ T cells isolated from Id3+/+ or Id3−/− mice and cultured for 24 h after stimulation with anti-CD3+CD28 with or without TGF-β1 plus IL-4 and presented relative to results obtained with control IgG, set as 1. (d,e) ChIP-coupled quantitative PCR analysis (d) and ChIP-sequencing analysis (e) of the enrichment of GATA-3 at Il9 promoter region in wild-type naive CD4+ T cells after stimulation with anti-CD3+CD28 with or without TGF-β1 plus IL-4 for 24h. (f) Luciferase assay of TGF-β1 and IL-4-induced Il9 activity (right) in naive CD4+ T cells with wild-type or E-boxes and/or GATA-3 binding site mutated Il9 constructs (left), assessed after stimulation with anti-CD3+CD28 with or without TGF-β1 plus IL-4 for 24h. Data are representative of two (c,d), three (a) and four (f) independent experiments. Error bars represent mean ± SD. * p<0.05, ***p<0.001 (Student’s t-test).