
Fig. 4.
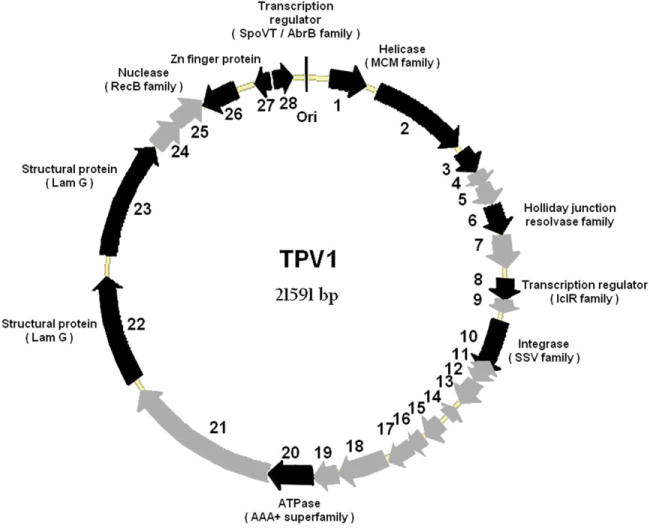
TPV1 genome map. Predicted genes are presented by thick arrows; grey arrows indicate ORFs with no similarity or unassigned function and black arrows indicate either conserved hypothetical ORFs or ORFs with an attributed function. The approximate location of the origin (Ori) of replication is also indicated.