
Figure 6.
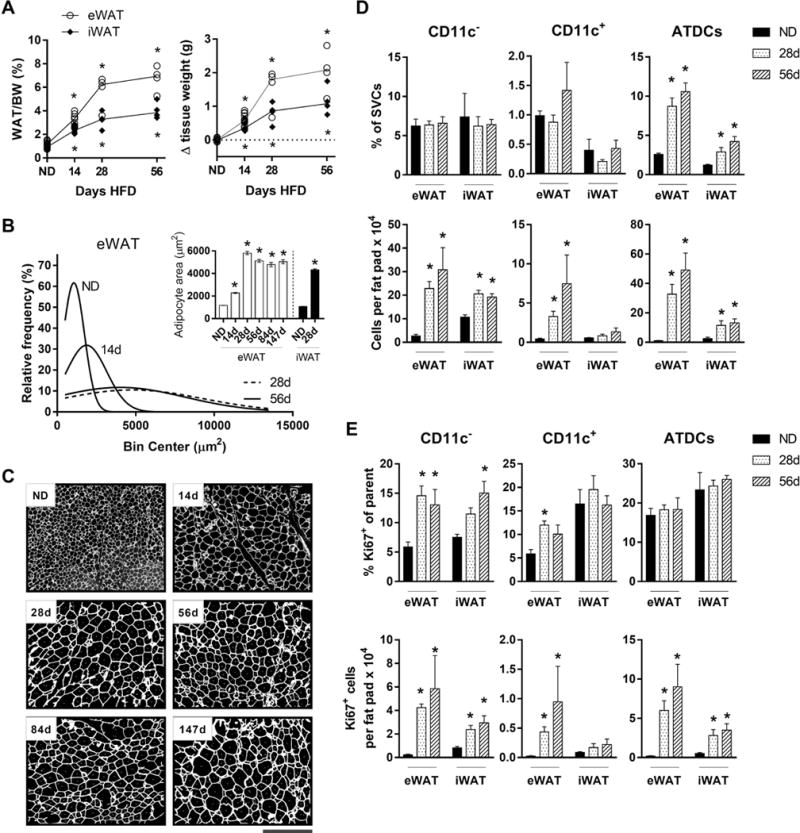
Adipocyte size corresponds to peak resident ATM but not ATDC quantity. (A). WAT weight and change in tissue weight in mice fed ND or HFD for 14-58 days. Upper and lower asterisks indicate significant for eWAT and iWAT, respectively, compared to ND controls. (B) eWAT adipocyte sizing curve approximations in mice fed ND or HFD for 14-58 days. Inset, mean eWAT and iWAT adipocyte sizes at given time points. (C) Images showing eWAT adipocyte sizes in mice fed ND or HFD for 14-147 days (see Materials and Methods). Scale bar represents 500 μm. (D and E) Frequency, quantity, and proliferating frequency and quantity of CD11c− ATMs, CD11c+ ATMs, and ATDCs in mice fed ND or HFD for 28-56 days. *, p<0.05.