
Figure 4. Loss of Top3α Induces mtDNA Catenane Formation.
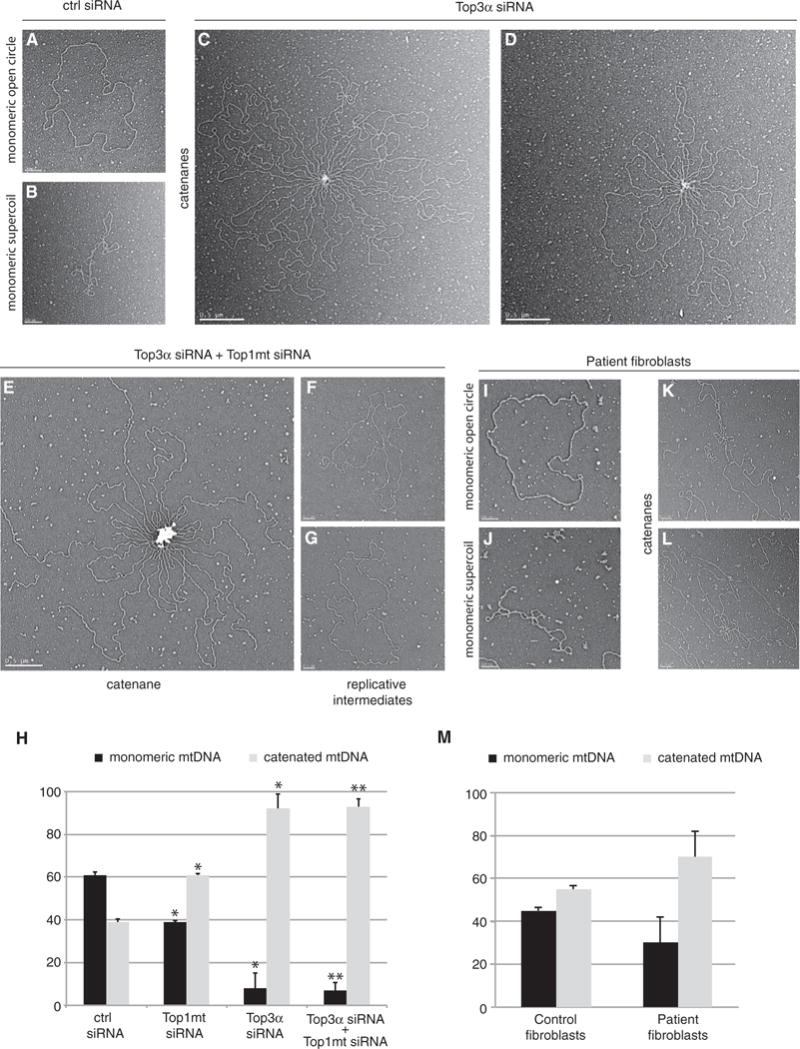
(A and B) Representive EM images of monomeric, open circular form mtDNA (A) and monomeric, supercoiled mtDNA (B) from control siRNA-treated cells. Scale bars, 200 nm.
(C and D) Representative EM images of catenated mtDNA from Top3α-depleted cells, example image 1 (C) and example image 2 (D). Scale bars, 0.5 mm.
(E) Representative EM images of catenated mtDNA from Top3α/Top1mt-depleted cells. Scale bar, 0.5 mm.
(F and G) Representative EM images of late-replicating mtDNA molecules from cells depleted of both Top3α and Top1mt, example image 1 (F) and example image 2 (G). Scale bars, 200 nm.
(H) Quantification of mtDNA molecules found in monomeric (relaxed and supercoiled) or catenated topological forms from EM analysis following the indicated siRNA treatments. Data are expressed as a percentage representing mean values from three independent experiments made in duplicate for each study group. Error bars represent SEM.
(I–L) Representative EM images of mtDNA from patient fibroblasts.
(I) Monomeric open circle (1n).
(J) Supercoiled monomeric mtDNA (1nsc).
(K) Catenane consisting of dimeric circles.
(L) Complex catenane consisting of trimeric circles (2n+1nsc). All scale bars, 200 nm.
(M) EM quantification of mtDNA in monomeric (open circle and supercoiled) and catenated forms from control and patient fibroblasts. Error bars represent SEM. Data are represented as a percentage representing mean values from two independent experiments made in duplicate for each study group.