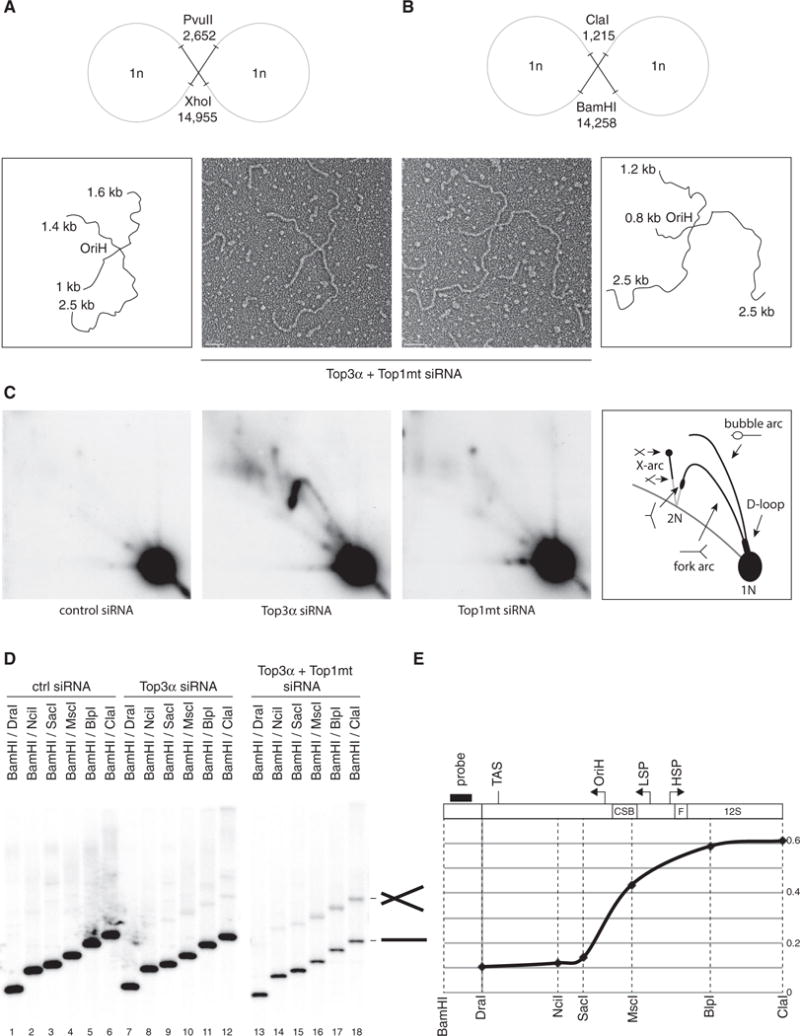
Figure 5. Catenane Formation Is Centered around OriH.

(A and B) Representative electron micrographs of X-shaped, NCR-containing mtDNA molecules, with interpretations. Restriction enzyme digestion with PvuII/XhoI (A) or BamHI/ClaI (B) generates species with arm lengths that map the junction to the OriH region: 1.8 kb/2.5 kb for PvuII/XhoI and 1 kb/2.5 kb for BamHI/ClaI. Scale bars, 200 nm.
(C) mtDNA from control, Top3α, or Top1mt-depleted cells was restricted using HincII, separated by 2D agarose gel electrophoresis, and detected using probe (a). X-shaped molecules are visible as an X-arc in Top3α-depleted cells.
(D) Total DNA from cells depleted of Top3α and Top1mt was restricted with the indicated enzymes, separated on agarose, and blotted using probe (b). X-shaped molecules are only visible when the probed fragment includes the molecule junction.
(E) Quantification of the proportion of X-shaped species, normalized to the level of linear species for the same digestion. Black bar indicates the probe. Dotted lines indicate the sites of restriction enzymes used. Gene loci and key sequence elements are indicated above the graph.
