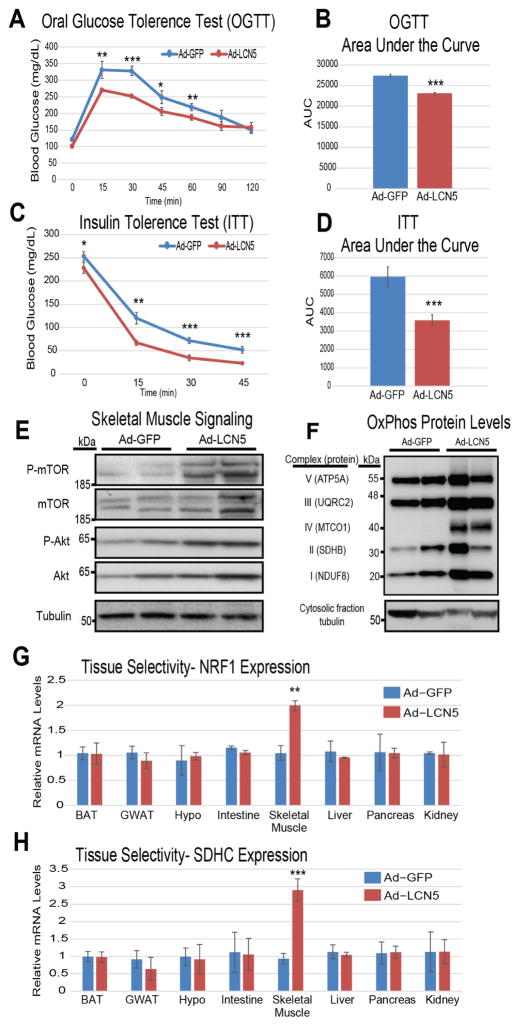
Figure 5. Lcn5 over-expression reverses the effects of diet-induced metabolic syndrome by enhancing skeletal muscle mitochondrial abundance.
Plasma concentration LCN5 in the Ad-GFP or Ad-Lcn5 groups assessed by immunoblot standard curve of recombinant protein (A). Mice fed a HF/HS diet for 6 weeks were administered either Ad-GFP or Ad-Lcn5 then evaluated for Oral glucose tolerance (B–C), insulin tolerance (D–E), skeletal muscle insulin signaling cascades (F) or mitochondrial complex abundance (G). The same animals were subjected to qPCR analysis for predicted genes Nrf1 (H) and Sdhc (I) across various tissues. n=5 per group, each tolerance test was performed on a separate group of mice. All data presented as mean ± SEM *p<0.05, **p<0.01, ***p<0.001

