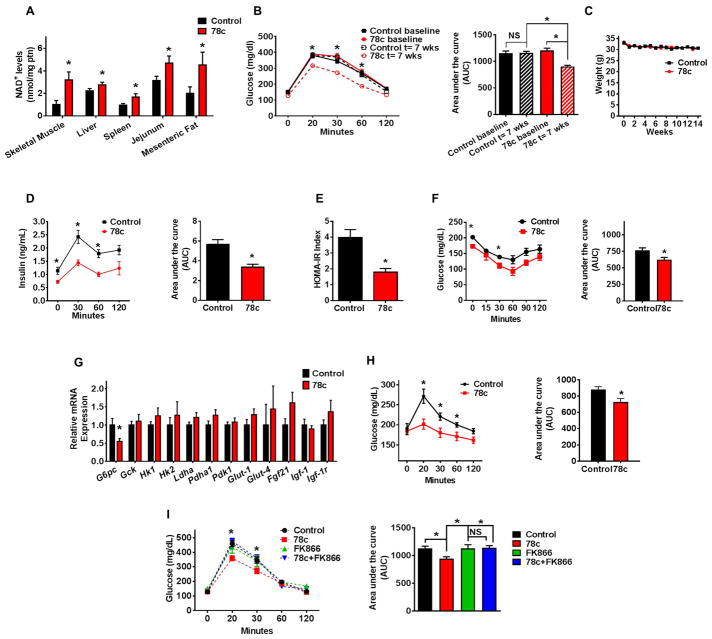
Figure 2. 78c ameliorates metabolic dysfunction-associated features in chronologically aged mice.
Aged (2-year-old) mice were treated with vehicle (Control) or 78c for up to 14 weeks. (A) NAD+ levels in multiple tissues (n=4–13 mice per group) at the end of the treatment.
(B) Intraperitoneal glucose tolerance test (ipGTT) at baseline and after 7 weeks of treatment, and corresponding area under the curve (AUC) graph. Analysis by two-way repeated measures ANOVA with Bonferroni's post-tests shows significant interaction between the glucose curve for control and 78c-treated mice. Results in panels B and C show average of two independent experiments (n=18–24 mice per group).
(C) Weekly body weight measurements.
(D) Serum insulin measurement (ELISA) during ipGTT and corresponding AUC after 5 weeks of treatment (n=5 mice per group).
(E) Homeostatic model assessment index for insulin resistance (HOMA IR) (n=5 mice per group).
(F) Intraperitoneal insulin sensitivity test (ipIST) and corresponding AUC after 4 weeks of treatment (n=5 mice per group).
(G) Liver mRNA levels of glucose metabolism-related genes, determined by quantitative RT-PCR (n=6–19 mice per group) at the end of the treatment.
(H) Intraperitoneal pyruvate tolerance test (ipPTT) and corresponding AUC after 9 weeks of treatment (n=5 mice per group).
(I) ipGTT of 2-year-old mice after 4 weeks of treatment with vehicle (Control), 78c, FK866 (NAMPT inhibitor), or 78c+FK866 and corresponding AUC (n=5 mice per group). Statistical differences were determined using Two-way repeated measures ANOVA followed by multiple-comparison testing using Bonferroni’s post hoc analysis; *P < 0.05 Control compared with the 78c group. All values are mean ± SEM. *P < 0.05. NS=not significant. See also Figure S2.

