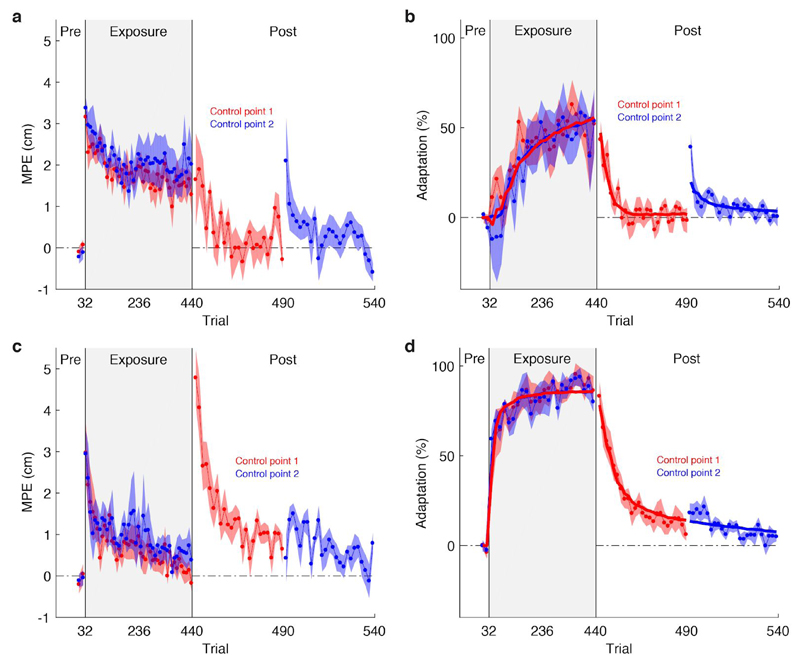
Figure 3.
The encoding of dynamics for different control points depends on the fields experienced. (a) MPE ± 1 s.e.m. and (b) adaptation ± 1 s.e.m. for each control point in the group that experienced opposing force fields at each control point (n = 8). Data in the pre-exposure and exposure phases were first averaged over blocks of eight trials. The post-exposure phase has been expanded for clarity. For simplicity, the sign of adaptation for control point 2 has been inverted. (c) & (d) are the same as (a) & (b) but for the group that experienced the same force field at each control point (n = 8). Solid lines in (b) and (d) show the mean switching state-space model fits across participants.

