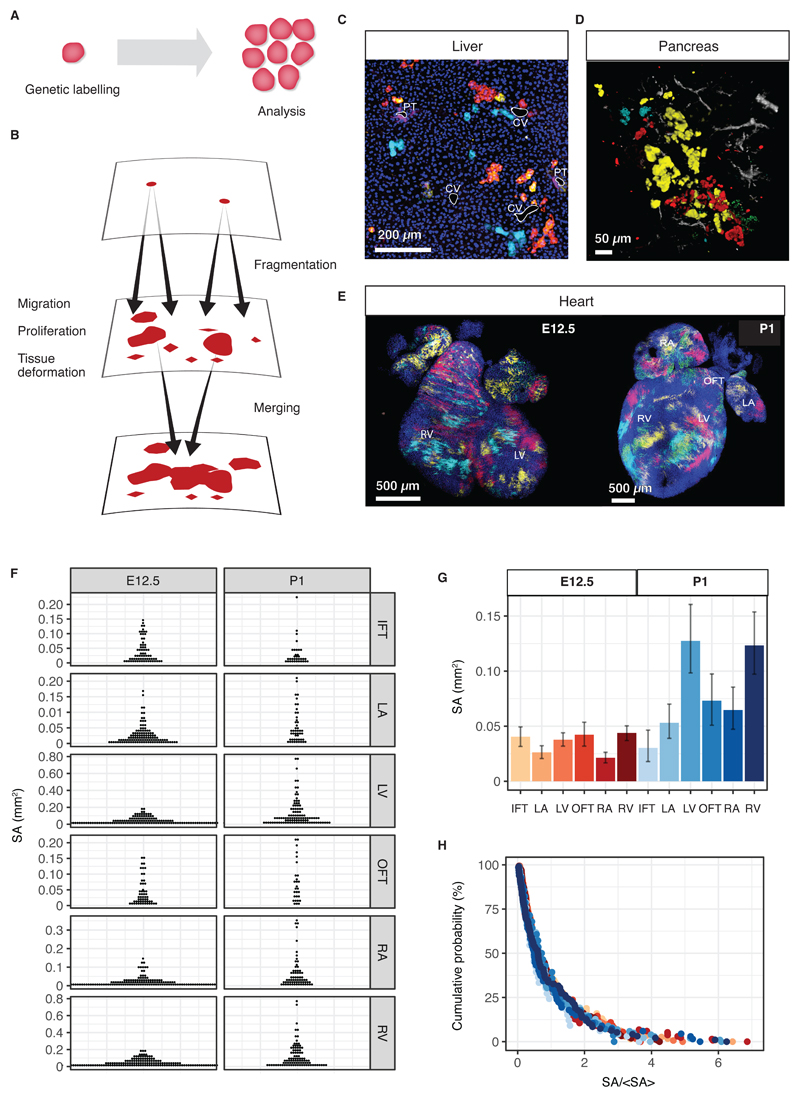
Fig. 1. Clonal dynamics during tissue development.
(A) Lineage tracing allows resolving clonal dynamics using a “two-time” measurement in living organisms. (B) Merger and fragmentation of labelled cell clusters occur naturally because of large-scale tissue rearrangements during the growth and development of tissues. (C,D) Illustration of clone fragmentation in mouse during the development of (C) liver and (D) pancreas (collection at post-natal day (P)45 and P14, respectively) following pulse-labelling using, respectively, R26R-CreERT2;Rainbow and R26R-CreERT2; R26-Confetti at E9.5 and E12.5, respectively. Portal tracts (PT) and central veins (CV) are highlighted in white, osteopontin (a ductal marker) is shown in purple and nuclei are marked in blue. Pancreatic ducts are shown in grey. (E) High density (mosaic) labelling of mouse heart using the Mesp1-Confetti system showing the left/right atrium (L/RA), left/right ventricle (L/RV) and the in/out-flow tracts (I/OFT). (F) Distributions of cell cluster sizes on the surface of the developing mouse heart at E12.5 (680 clusters from 4 mice) and P1 (373 clusters from 3 mice). (G) Average cluster sizes in different heart compartments and time points during development. Error bars denote 95% confidence intervals. (H) Rescaled cluster size distributions showing scaling behaviour.

