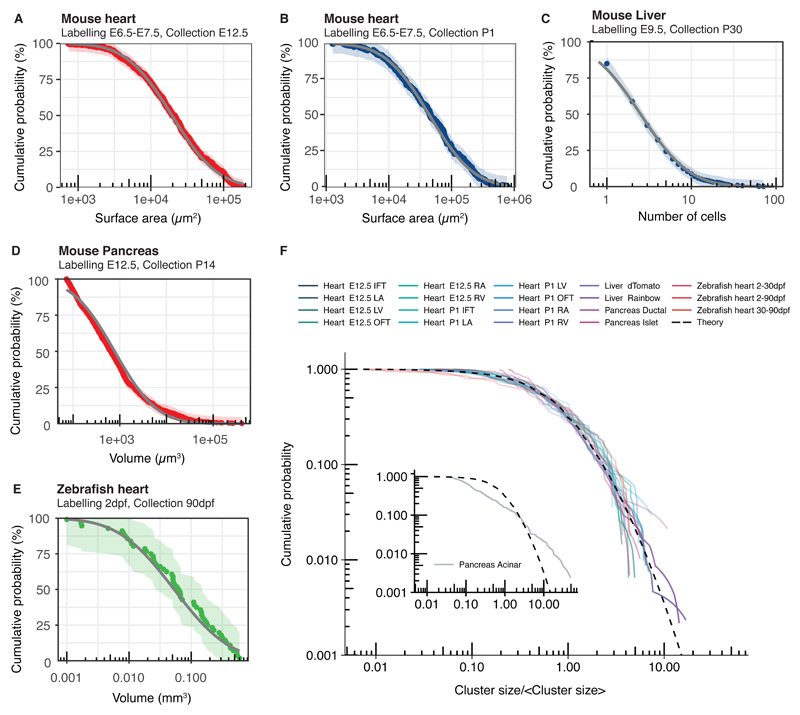
Fig. 3. Universality of cluster sizes in different tissue types and organisms.
(A-B) Cumulative cluster size distributions obtained from lineage tracing studies of the mouse heart. (C-E) Experimental cumulative cluster size distributions for (C) mouse liver (892 clusters from 4 mice), (D) mouse pancreas (988 clusters from 3 mice), and (E) zebrafish heart (from (20)) collapse onto the predicted universal log-normal dependence fitted by maximum likelihood estimation (grey). Data shown in colour and shading shows 95% Kolmogorov confidence intervals. (F) Experimental cumulative cluster size distributions (solid lines) separated by time, region, cell type labelling strategy collapse onto a universal shape (dashed line) with the exception of a subset of pancreatic acinar cells (inlay).

