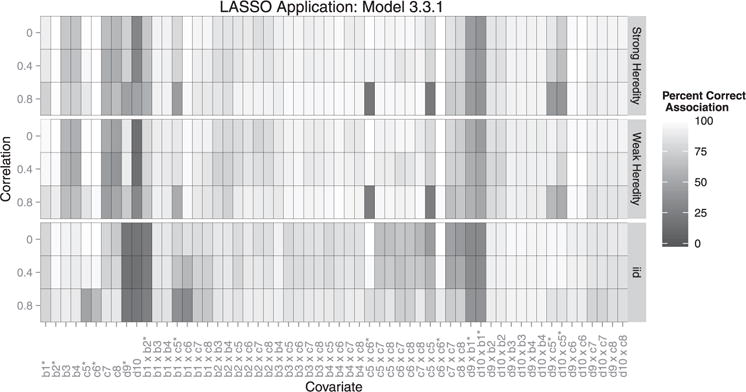
Figure 4.

Each box represents the correct association percentage for a covariate. The lighter the box, the better the model performed for that variable, averaged over all simulations. Whether or not a covariate should be included depends on the heredity constraint given. For example: if covariate c1 is associated with the outcome, but c2 is not, a strong constraint would exclude their interaction but a weak or no heredity constraint should include it. ∗Covariates existing in the true model.
