Figure 2.
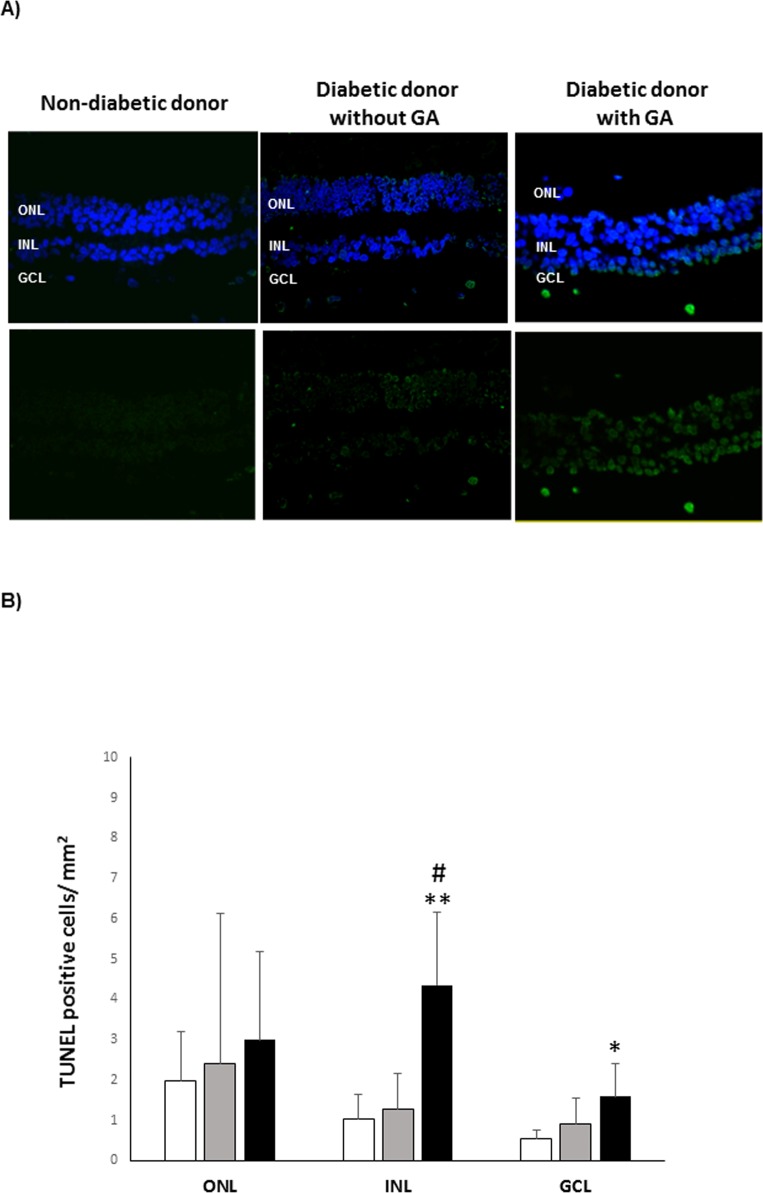
Retinal apoptosis. (A) TUNEL-positive immunofluorescence (green) in a representative donor from each group (C, D, and D+GFAP). Nuclei were labeled with DAPI (blue). (B) Quantification of TUNEL-positive cells. The results were normalized taking into account the area analyzed. Results are mean ± SD. (C) white columns; (D) gray columns; D+GFAP: black columns. n = 5 donors by group. *P < 0.05 compared to group C; **P < 0.001 compared to group C; #P < 0.01 compared to group D.

