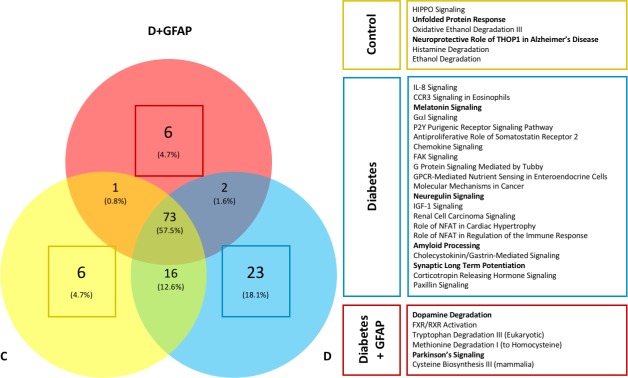
Figure 5.
Unique pathway assignments by study group. Significantly identified pathways in each of the three biological samples were compared. Significant homology was seen among all three groups with a total of 73 shared pathway assignments (58% of total pathway assignments). However, a substantial number of unique pathways were identified in each condition. Pathway assignments for the unique protein IDs in each sample group were assigned using the IPA software platform. Selected pathways unique to each study group are highlighted in their respective boxes. Selected pathways involved in neuroregulatory cell functions or neurodegeneration are bolded.

