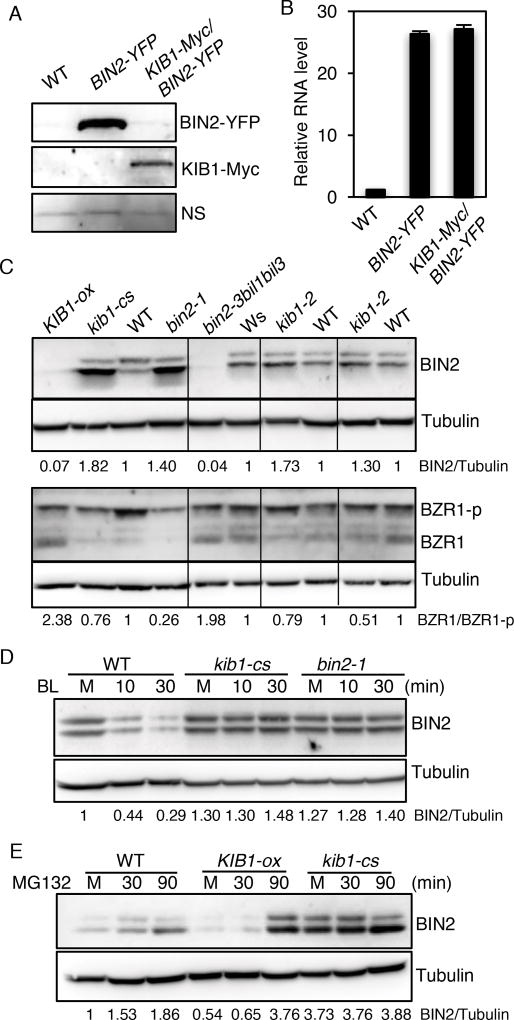
Figure 4. KIB1 is required for BR-induced BIN2 degradation.
(A) Overexpression of KIB1 decreased BIN2 protein level. Immunoblot shows BIN2-YPF and KIB1-Myc protein levels in the seven-day-old BIN2-YFP and KIB1-Myc/BIN2-YFP transgenic Arabidopsis using the anti-GFP or anti-Myc antibody. Nonspecific bands (NS) show the protein loadings.
(B) Quantitative RT-PCR analysis of the expression level of BIN2 in the plants from (A). The gene expression levels were normalized to PP2A and presented as values relative to that of WT. The data are shown as means of three biological repeats ± SD.
(C) Immunoblot analyses of BIN2, phosphorylated (BZR1-p) and de-phosphorylated BZR1(BZR1) levels of ten-day-old seedlings of the indicated genetic backgrounds using the anti-BIN2, anti-BZR1 or anti-Tubulin anti-body. The numbers below the blots indicate the relative ratios of the signal intensity between BIN2 and Tubulin bands (BIN2/Tubulin) or the ratios of the signal intensity between de-phosphorylated BZR1 and phosphorylated BZR1(BZR1/BZR1-p) bands. The ratios were normalized to WT control for each set of experiments.
(D–E) KIB1 is required for BR-induced BIN2 degradation by the proteasome. (D), ten-day-old seedlings of WT, kib1-cs and bin2-1 grown on the medium with 2 µM PPZ under the light were treated with mock solution for 30 minutes (M) or with BL (100 nM) for 10 and 30 minutes. (E), seven-day-old seedlings of WT, KIB1-ox and kib1-cs grown under the light were treated with mock solution (M, 30 min) or with 10 µM MG132 (30 or 90 min). The immunoblots were probed with the anti-BIN2 antibody or anti-Tubulin antibody. The numbers below the blots indicate the relative ratios of the signal intensity between BIN2 and tubulin bands (BIN2/Tubulin).

