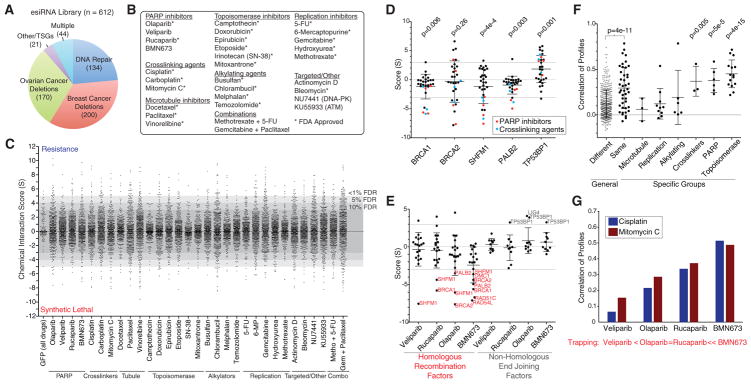
Figure 1. Design of a Chemical-Genetic Interaction Map and Recapitulation of Known Gene and Drug Relationships.
(A) Composition of genes selected for the map. TSGs, tumor suppressor genes.
(B) Selection of 31 drugs profiled in this study.
(C) Distribution of chemical genetic interaction scores (S) for drugs profiled. Scores of 899 GFP knockdowns across all tested drugs are indicated. FDR cutoffs are based on the percentage of GFP knockdowns falling outside of a given score threshold. Metho, methotrexate; Gem, gemcitabine.
(D) Genetic interactions with BRCA-pathway members BRCA1, BRCA2, SHFM1, and PALB2, as well as the NHEJ factor TP53BP1. Interactions with PARP inhibitors and crosslinking agents are highlighted, and p values represent the significance of differences between these scores and zero, using a t test. Dotted lines represent 10% FDR cutoff.
(E) PARP inhibitor scores with annotated HR and NHEJ factors.
(F) Correlation of interaction profiles among drugs that belong to the same or a different class. For each drug class, pairwise correlations were compared against a background of correlations between drugs from different classes to determine a p value.
(G) Correlation of profiles for PARP inhibitors with two cross-linking agents, cisplatin and mitomycin C. Trapping potency published in Murai et al. (2014).
Data indicate mean ± SD.

