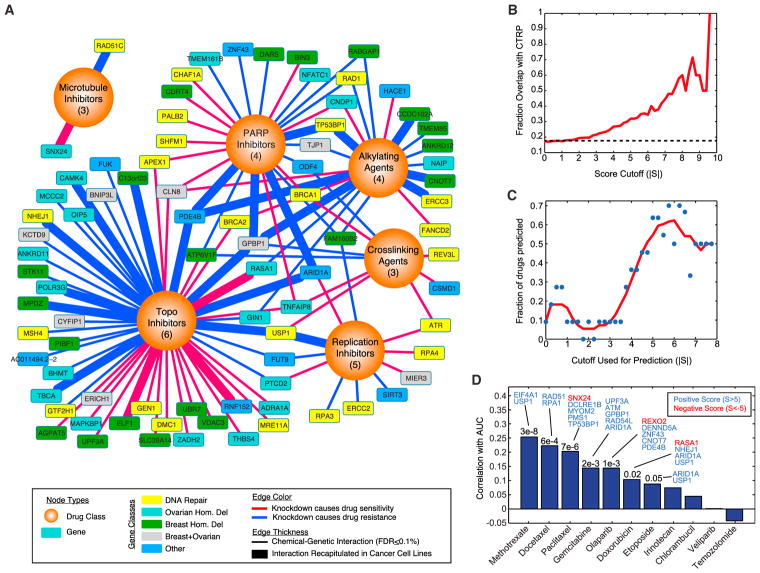
Figure 2. Prediction of Cell Line Responses from the Chemical-Interaction Map.
(A) Consensus interaction map based on coordinate responses with drug classes. All interactions shown have an FDR of category association <0.1%. The number of drugs in each category is indicated. Thicker edges represent interactions that are also found across cancer cell line collections (p < 0.01).
(B) Overlap with correlation-based chemical-genetic interactions from cancer cell lines. Indicated is the fraction of chemical-genetic interactions at a given score cutoff (|S|), where the expression of the gene is also significantly associated with resistance or sensitivity to the same drug across cell lines in the CTRP dataset (p < 0.01). Dotted line represents baseline overlap at random (17.3%).
(C) Prediction of cell line responses to 11 drugs overlapping with the CTRP dataset. Cell lines were scored based on the sum of normalized gene expression for all genes in the network at a given cutoff (Experimental Procedures). These drug- and cell-line-specific scores are then correlated with the area under curve (AUC) values reported in the CTRP, and significant predictors are counted (p ≤ 0.05). Red line indicates a sliding average.
(D) Analysis of cell line response predictions based on a score cutoff of 5. For each model, the correlation of predicted AUC versus real AUC is indicated, with accompanying p values when significant. Genes whose expression contributed the most to the prediction accuracy are indicated (Experimental Procedures).
See also Figures S1 and S2 and Table S3.

