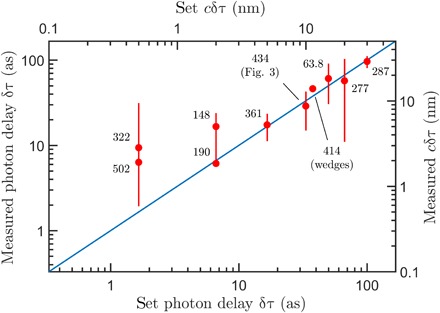
Fig. 4. Experimentally measured photon delays induced by the piezo shown against the set values on the piezo actuator.

Number of individual measurements and integrations times vary as indicated in the plot (labels denote billions of incident biphotons). Total acquisition times for each data point ranged between 1.4 and 15.6 hours. Error bars represent an interval of length . The data point corresponding to the glass wedges should only be read on the top and right axes (because of the nonunit refractive index).
