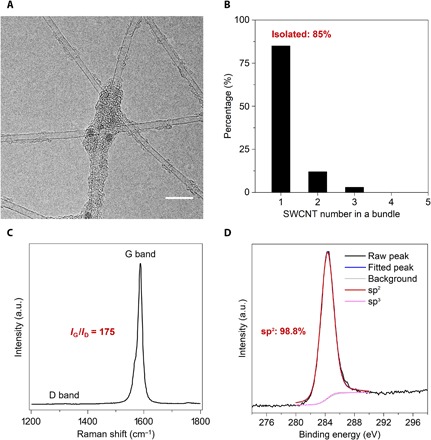
Fig. 1. Microstructures of isolated SWCNTs with carbon-welded joints.

(A) Typical TEM image. Scale bar, 10 nm. (B) Statistical data of the numbers of isolated and bundled SWCNTs in the network. (C) Raman spectrum excited by a 633-nm laser. (D) C 1s XPS spectrum. a.u., arbitrary units.
