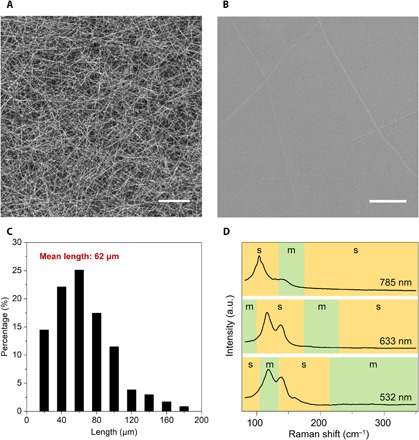
Fig. 2. SEM images, length distribution, and Raman spectra of the SWCNTs.

(A and B) SEM images of SWCNT networks on SiO2/Si wafers transferred from filter membranes with collection times of 10 min and 5 s, respectively. Scale bars, 0.5 μm (A) and 10 μm (B). (C) Length distribution of the SWCNTs measured by SEM. (D) RBM mode Raman spectra of the SWCNTs excited by 532-, 633-, and 785-nm lasers.
