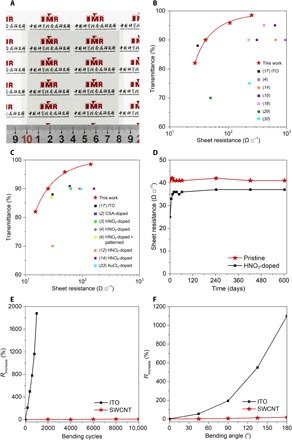
Fig. 3. Performance of SWCNT TCFs.

(A) Optical image of an 80 mm × 80 mm SWCNT TCF. (B) T (for 550-nm light) versus Rs of our SWCNT TCFs together with the previously reported results for untreated CNT TCFs in the literature (4, 14, 15, 18, 29, 30) and a superior ITO TCF on a polymer substrate (17). (C) T (for 550-nm light) versus Rs of our doped SWCNT TCFs together with the reported results for doped CNT TCFs in the literature (2–4, 12, 14, 33) and the superior ITO TCF (17). For our SWCNT TCFs in (B) and (C), the Rs was measured at least four different points for every TCF, and the maximum Rs deviation for specific T is below 6% by performing three or four experiments. (D) Variations in Rs of the pristine and the HNO3-doped SWCNT TCFs exposed to ambient air for over 20 months. (E) Variations in Rs of the SWCNT and the commercial ITO-PET TCFs as a function of the cycles of bending to a radius of 5 mm. (F) Variations in Rs versus bending angle for the SWCNT and the commercial ITO-PET TCFs.
