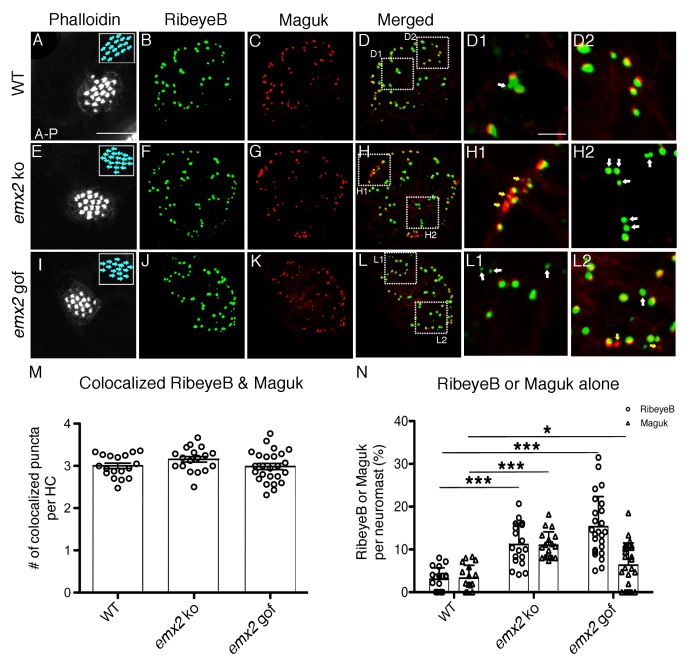
Figure 5. The number of RibeyeB- and Maguk-positive puncta is altered in emx2 mutant neuromasts.
(A–D) A wildtype neuromast consisting of nine A > P and eight P > A HCs is stained with phalloidin (A), anti-RibeyeB (B) and anti-Maguk (C) antibodies. (D) A merged image of (B) and (C) showing co-localization of RibeyeB and Maguk. (D) A merged image of (B) and (C) showing co-localization of RibeyeB and Maguk. (D1,D2) Insets in (D) from selected optical sections showing the co-localized RibeyeB and Maguk but one has RibeyeB staining only (white arrow). (E–H2) An emx2 ko neuromast with only P > A HCs (E) is stained with anti-RibeyeB (F) and anti-Maguk (G) antibodies. (H) A merged image of (F) and (G). (H1,H2) Insets in (H) from selected optical sections showing RibeyeB (white arrows) or Maguk (yellow arrows) staining alone. (I–L2) A phalloidin-labeled emx2 gof neuromast with only A > P HCs (I) is stained with anti-RibeyeB (J) and anti-Maguk (K) antibodies. (L) A merged image of RibeyeB and Maguk. (L1,L2) Insets in (L) from selected optical sections showing staining of RibeyeB (white arrows) or Maguk (yellow arrows) alone. (M) The number of colocalized RibeyeB and Maguk puncta per HC is similar between wildtype and emx2 mutant neuromasts. (N) The percentages of single RibeyeB and Maguk puncta per neuromast are higher in emx2 mutant than wildtype neuromasts. The number of neuromasts: WT n = 18, emx2 ko n = 18, emx2 gof n = 25, obtained from three independent experiments. The one-way ANOVA was used for the comparisons shown in (M) and (N). *p<0.05, ***p<0.001. Scale bar in (A) equals10 μm and applies to all lower magnification images, and scale bar in D1 equal 2.5 μm and applies to all higher magnification images.

