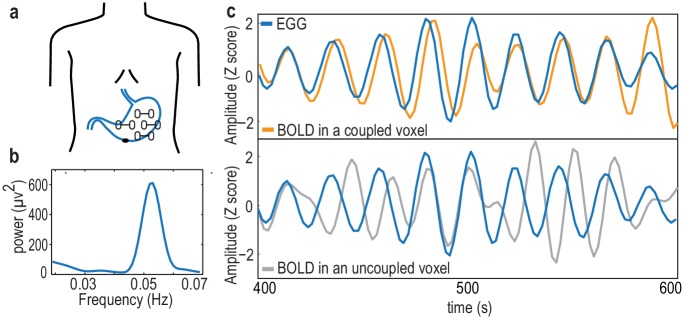
Figure 1. The electrogastrogram (EGG) and gastric-BOLD coupling.
(a) Bipolar electrode montage used to record the EGG. (b) Example of an EGG spectrum in a single participant, with the typical spectral signature in the normogastric frequency range (0.033–0.066 Hz). (c) Example of a 200 s time series of the EGG and BOLD signal filtered at the gastric peak frequency in an EGG-coupled voxel (top), characterized by a stable, non-zero phase relationship between EGG and BOLD, resulting in a high phase-locking value, and in an EGG-uncoupled voxel (bottom) in which no stable phase relationship between EGG and BOLD can be observed.

