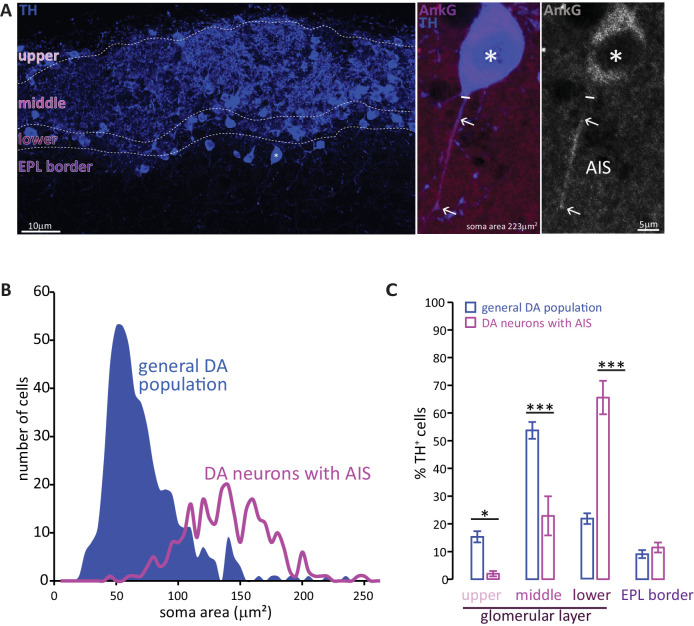
Figure 1. Two subtypes of DA neuron can be characterised based on size, location and presence of an AIS.
(A) Left: example image of olfactory bulb stained with an anti-TH antibody (blue). Dashed lines indicate subregions of the glomerular layer (GL). The asterisk indicates an AIS-positive DA cell. Middle, right: zoomed image of the asterisked cell from the left panel, co-stained for TH (blue) and the AIS marker ankyrin-G (AnkG, magenta or greyscale). The solid line indicates the emergence of the axonal process from the soma; arrows indicate AIS start and end positions. (B) Frequency plots showing soma area of the general DA population (blue, filled area, n = 519, N = 3), and of the subset of DA neurons that possesses an AIS (magenta line, n = 271, N = 6). (C) Locations in the GL for both the general DA population (blue, mean ± sem; n = 888, N = 6) and AIS-positive DA neurons (magenta, mean ± sem; n = 127, N = 6). Post-hoc Sidak’s test following two-way repeated measures ANOVA; *p<0.05; ***p<0.001.

