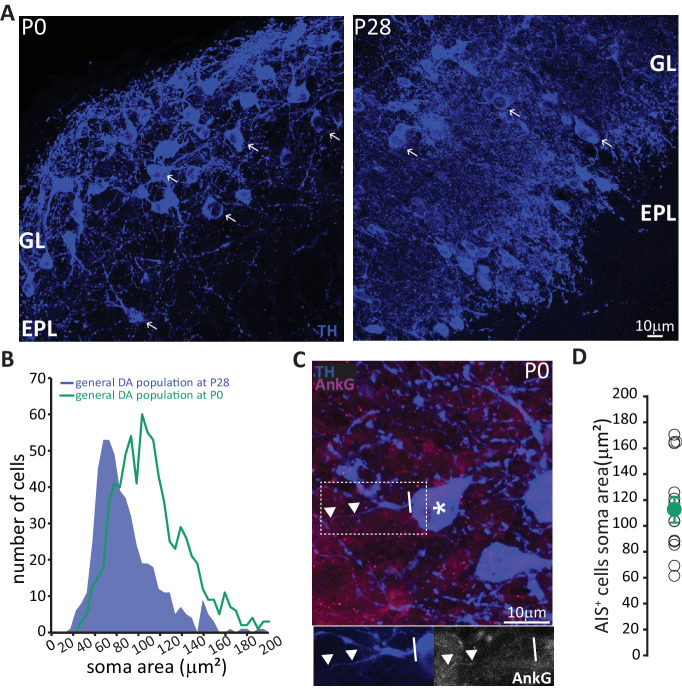
Figure 6. In neonates there is a preponderance of large DA neurons that can already possess an AIS.
(A) Low-magnification example images of tissue from P0 and P28 wild-type mice stained with an antibody against TH (blue). Arrows indicate cells with a soma area bigger than 100 μm2; ‘GL’ indicates glomerular layer, ‘EPL’ indicates external plexiform layer. (B) Soma area distribution of TH +DA cells in P0 mice (teal, n = 781, N = 3), overlaid on the soma area distribution of the general DA cell population at P28 (blue filled line; see Figure 1B); Kolmogorov-Smirnov test between the two distributions **, D = 0.3581, p<0.01. (C) High-magnification example image of tissue from a P0 mouse stained with antibodies against TH (blue) and AnkG (magenta). Asterisk indicates the soma of an AIS-positive cell; dashed lines show the inset area magnified below; solid line shows axon start; triangles indicate AIS start and end positions. (D) Soma area of TH+/AnkG+ DA cells in P0 mice. Empty circles represent individual cells, full circle shows mean ± SEM (110 ± 10 μm2; n = 16, N = 2).

