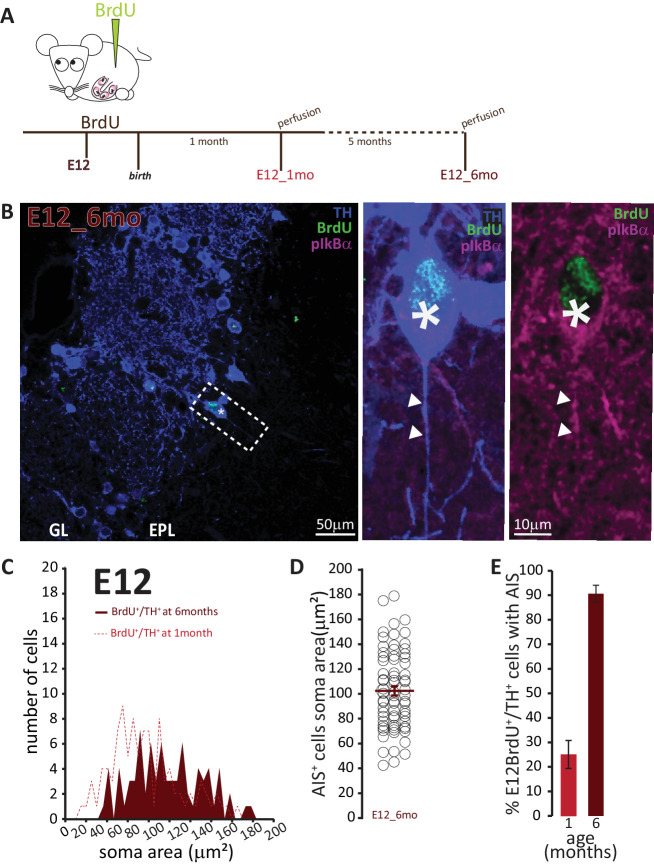
Figure 7. AIS-positive cells form the vast majority of embryonically-generated DA neurons that persist throughout adult life.
(A) Schematic representation of the experimental strategy: pregnant wild-type mice were injected with a single dose of BrdU at E12. Tissue was collected from their offspring when they reached 6 months of age and compared with data collected from littermates perfused at 1 month of age (data shown in Figure 6C). (B) Left: Low-magnification example image of 6-month-old tissue stained with antibodies against BrdU (green), TH (blue) and the AIS marker pIκBα (magenta). GL, glomerular layer; EPL, external plexiform layer; asterisk indicates an E12-6mo BrdU+/TH+ DA cell; dashed line indicates the inset magnified on the right. Right: magnified example image of an E12-6mo BrdU+/TH+/pIκBα+cell; solid line indicates axon start; arrows show AIS start and end positions. (C) Soma area distribution of E12-6mo BrdU+/TH+ DA cells (dark red, n = 78, N = 4), overlaid on the soma area distribution of E12-1mo BrdU+/TH+ DA cells (dashed light red line; see Figure 4C). (D) Soma area of E12-6mo BrdU+/TH+/pIκBα+ DA cells. Empty circles represent individual AIS-positive neurons, dark red lines show mean ± SEM (102 ± 4 μm2; n = 71, N = 4). (E) Mean ± SEM percentage of AIS-positive E12-BrdU+/TH+ DA cells in tissue from 1-month-old (light red, 25%; n = 100, N = 3) and 6-month-old (dark red, 91%; n = 78, N = 4) mice.

