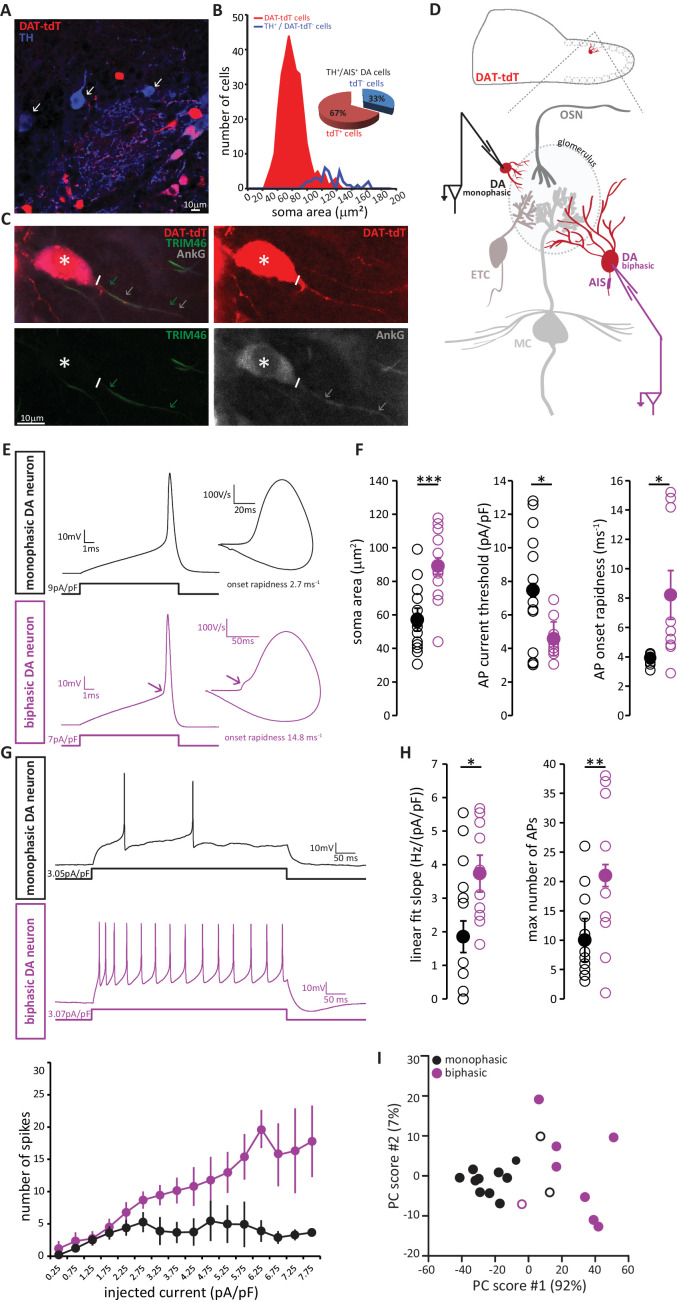
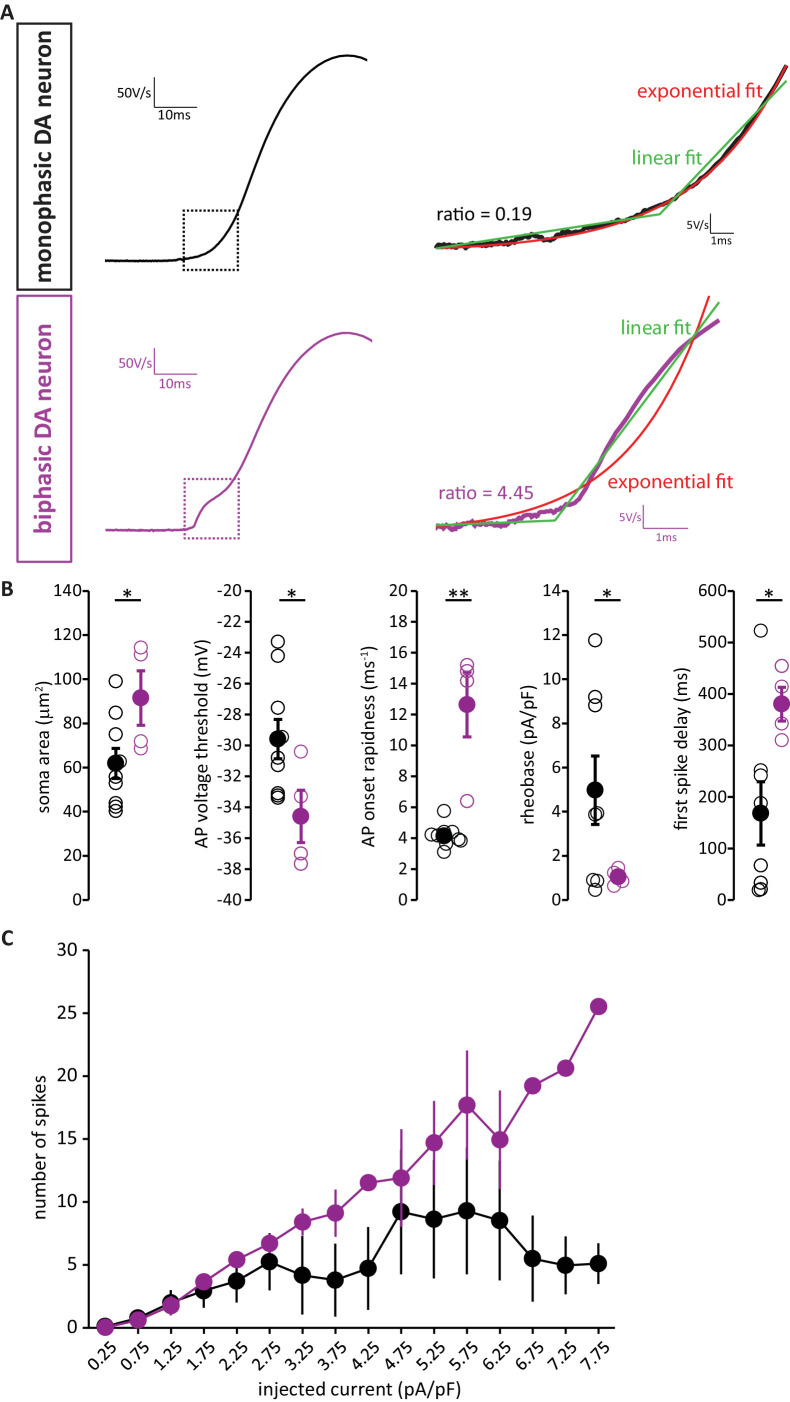
Figure 8. AIS-positive DA neurons have greater intrinsic excitability.
(A) Example image of a fixed, 50 µm OB slice from a P28 DAT-tdT (red) mouse, immunostained with an anti-TH antibody (blue). While most TH-positive neurons exhibit red tdT fluorescence, some are tdT-negative (arrows). (B) Soma size distributions of all DAT-tdT-positive cells (red), and of DA neurons that are DAT-tdT-negative but TH-positive (blue). Inset: percentages of AIS-positive/TH-positive DA cells that are either tdT-positive or –negative (n = 50, N = 5). (C) Example image of a DAT-tdT-labelled DA cell (red) stained with the axonal marker TRIM-46 (green) and the AIS marker AnkG (greyscale). Asterisks indicate the soma; line indicates axon start; arrows indicate start and end position of the TRIM (green) and AnkG (white) label. (D) Schematic representation of the experimental strategy for whole-cell recordings: acute 300 µm OB slices were obtained from P21-35 DAT-tdT mice, and tdT-positive DA cells of either subtype were targeted for whole-cell patch-clamp recording. (E) Example current-clamp traces of single APs fired by monophasic (AIS-negative, black, n = 15) and biphasic (AIS-positive, magenta, n = 11) DAT-tdTomato neurons. Left: action potentials fired to threshold 10 ms somatic current injection. Right: phase plane plots of the spikes shown on the left. Arrow points to the AIS-dependent first action potential phase. (F) Quantification of soma area (t-test; ***p=0.0006), current threshold (Welch-corrected t-test; *p=0.017), and onset rapidness (Welch-corrected t-test; *p=0.035) in monophasic and biphasic cells. Empty circles show values from individual cells, filled circles show mean ± SEM. (G) Top: Example current-clamp traces of multiple APs fired in response to a 300pA/500 ms somatic current injection in monophasic and biphasic cells. Bottom: input-output curve of injected current density versus mean ± SEM spike number for each group. (H). Quantification of input-output slope (t-test; *p=0.044), and of the maximum number of action potentials fired by each cell over the whole range of injected current intensities (t-test; **p=0.0092). Empty circles show values from individual cells; filled circles show mean ± SEM. (I) Classification of DAT-tdT neurons based on values obtained from whole-cell recordings. Each circle shows one cell, plotted according to its primary and secondary PCA component scores (these components accounted for 92% and 7% of the variance in the data, respectively). Filled circles show cells correctly classified by k-means analysis; open circles show the few cells (3/26 overall) that were incorrectly classified.


