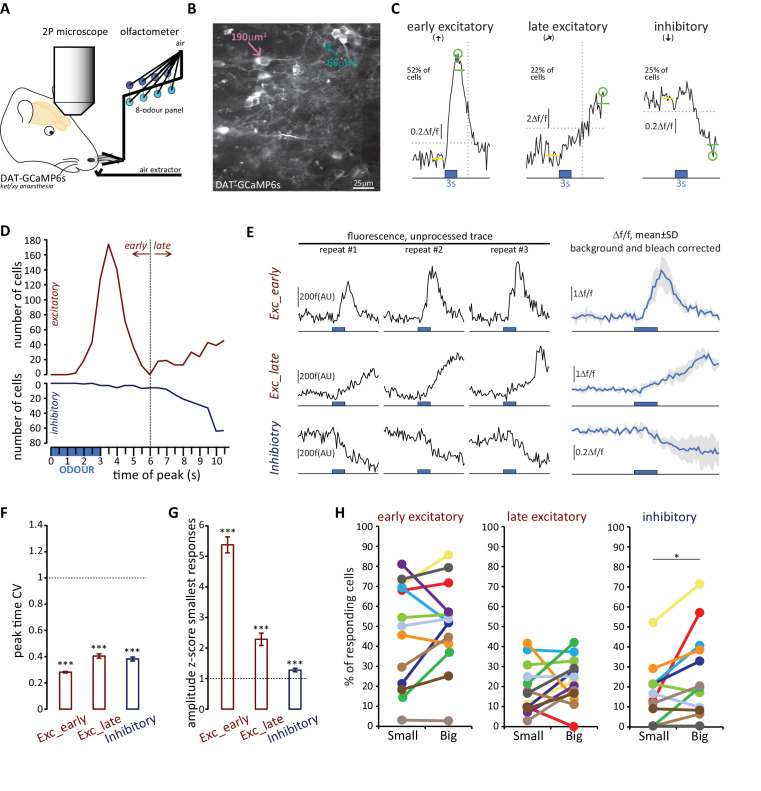
Figure 9. Both OB DA cell subtypes display diverse odour response types.
(A) Schematic representation of the experimental strategy for in vivo recordings: adult DAT-GCaMP6s mice (anaesthetised with ketamine/xylazine) were presented with a panel of eight odours. Resulting changes in GCaMP fluorescence in DA neurons were imaged through a cranial window positioned over the OB. (B) Example field of view of the deeper part of the glomerular layer used for image acquisition (sum intensity projection of time axis, enhanced contrast). Fields of view were selected so as to contain both ‘big’ (soma area >99 μm2, putatively AIS-positive; magenta arrow) and ‘small’ (soma area <70 μm2, putatively AIS-negative; green arrow) DA neuron types. (C) Representative examples of the three categories of Δf/f GCaMP responses that we observed in the dataset. Deflections from baseline were considered events when they exceeded a threshold (horizontal dashed line) set at three times the baseline standard deviation. Excitatory responses occurred either quickly after odour presentation (early excitatory responses,[↑]; recorded in 52% of cells) or on a later timeframe (late excitatory responses, ; recorded in 22% of cells). The early/late cut-off value was 6 s (vertical dashed line; see Materials and methods). Approximately a fifth of all cells also showed supra threshold negative deflection from baseline (inhibitory responses [↓]; present in 25% of cells). Green circle indicates absolute maximum or minimum value (peak) and green line shows the mean of the 3 s around the peak; yellow line indicates the 3 s of baseline prior to odour presentation (blue box). (D) Time of peak frequency plot for excitatory (red) and inhibitory (blue) events occurring after 3 s odour presentation (blue bar). The vertical dashed line indicates the cut-off value for early (≤6 s) and late (>6 s) excitatory responses. (E) Left: Raw fluorescence traces of early-excitatory, late-excitatory and inhibitory responses to three repeated presentations of a 3 s odour stimulus (blue box). Right: Mean Δf/f response over the three repeats, after background subtraction and bleach correction. Grey shading indicates standard deviation (SD). (F) Mean ±SEM coefficient of variation (CV) of peak time over the three odour presentations for early excitatory, late excitatory and inhibitory responses. Wilcoxon test vs. 1; ***p<0.001. (G) Mean ± SEM amplitude z-score value (mean of the two smallest responses out of the three odour repeats) for early excitatory, late excitatory and inhibitory responses. Wilcoxon test vs. 1; ***p<0.001. (H) Percentage of small (putative AIS-negative) and big (putative AIS-positive) cells in each mouse that showed at least one early excitatory (left), late excitatory (middle) or inhibitory (right) response. Colour-coding indicates the 13 mice that were imaged. Wilcoxon paired rank test; *p<0.05.

