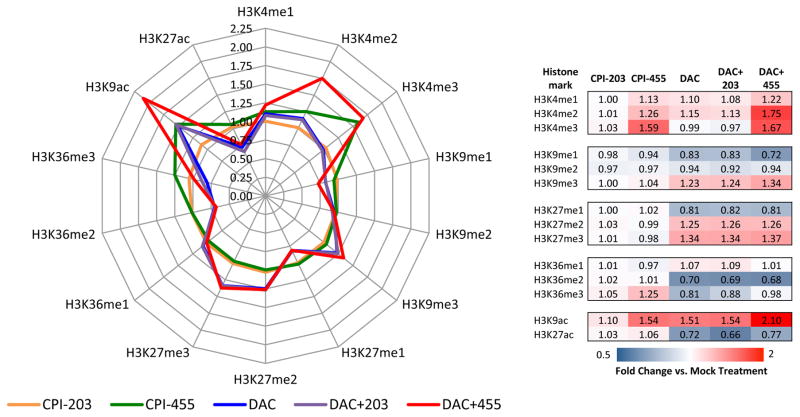
Figure 1. Changes in histone modification levels following KDM5i alone or in combination with DAC.
Enrichment of various H3 modifications were analyzed by mass spectrometry. Enrichment fold change is shown relative to treatment mock. Left- radar plot of fold enrichment. Right- Table heatmap of enrichment fold change.

