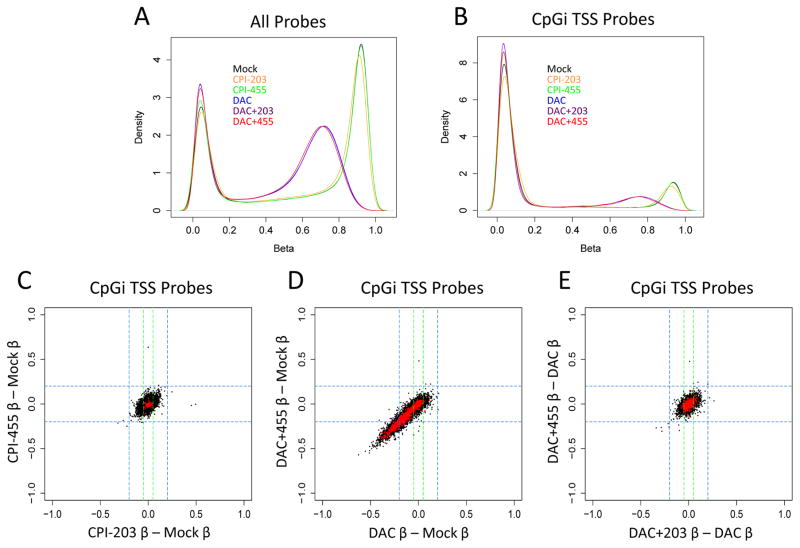
Figure 3. Combination treatment does not result in further DNA demethylation relative to DAC alone.
A&B. Density plot of beta values (an estimate of methylation levels using ratio of methylated probe intensity and overall intensity) for MCF-7 cells exposed to DAC +/− KDM5i using either all probes (A) or only CpGi probes near TSS (B). C. Delta beta values for all CpGi TSS probes (in black) in CPI-455 (y-axis) and CPI-203 (x-axis) relative to mock. Probes corresponding to CPI-455 upregulated genes highlighted in red. D. Delta beta values for all CpGi TSS probes (in black) in DAC+455 (y-axis) and DAC (x-axis) relative to mock. Probes corresponding to DAC upregulated genes highlighted in red. E. Delta beta values for all CpGi TSS probes (in black) in DAC+455 (y-axis) and DAC+203 (x-axis) relative to DAC. Probes corresponding to DAC upregulated genes highlighted in red.

