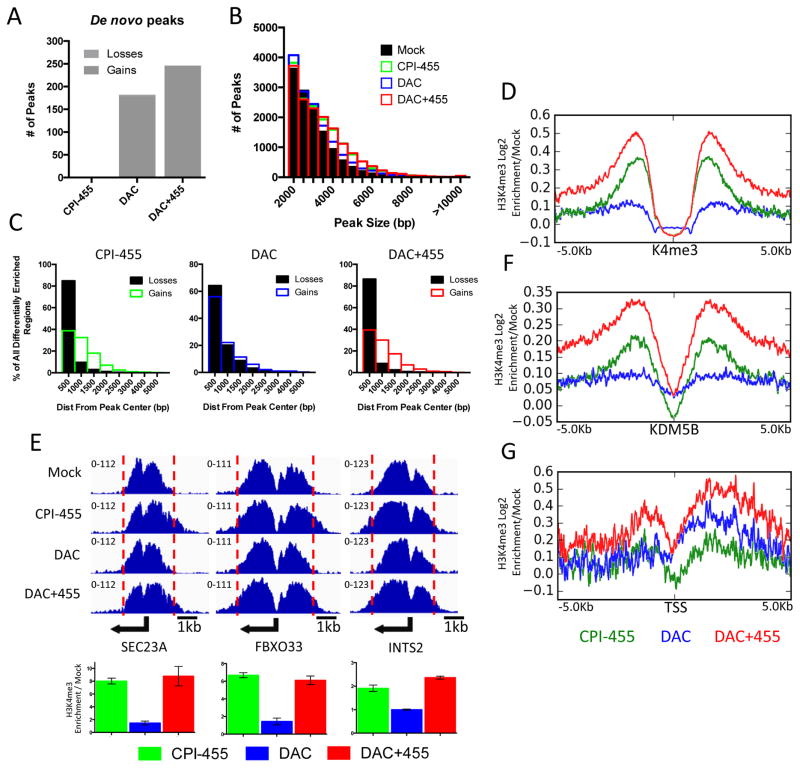
Figure 4. Treatment with CPI-455 results in spreading of H3K4 trimethylation.
A. Total number of de novo gained or lost H3K4me3 peaks after exposure to CPI-455, DAC, or both. B. Frequency distribution of peak size in each treatment group. C. Bar plot depicting distance of differentially enriched regions from center of aligned peak after treatment with CPI-455 (left panel), DAC (middle panel), or both (right panel). D. Tag density plot of H3K4me3 gains relative to mock at all basally marked H3K4me3 regions in MCF-7. E. H3K4me3 ChIP-seq genome view for 3 genes (top), with qPCR validation (bottom). Error bars indicate SE of three biological replicates. F&G. Tag density plot of H3K4me3 gains relative to mock at KDM5B marked regions in MCF-7 (F), and promoters of all genes upregulated by DAC (G).

