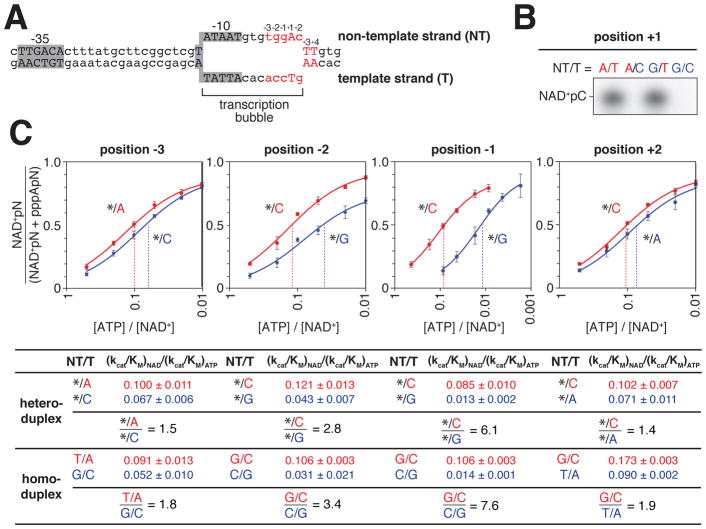
Figure 6. Strand specificity of NCIN capping with NAD+ in vitro.
A. lacCONS promoter derivative containing consensus A+1 promoter sequence in context of RNAP-promoter open complex. DNA non-template strand (NT) on top; DNA template strand (T) on bottom; Unwound, non-base-paired DNA region, “transcription bubble,” indicated by raised and lowered nucleotides
B. Products of transcription reactions with NAD+ as initiating nucleotide and [α32P]-CTP as extending nucleotide for templates having the consensus nucleotides at the TSS, position +1, on both DNA strands, non-template strand only, template strand only, or neither.
C. Dependence of NAD+ capping on [ATP] / [NAD+] ratio for templates having an abasic site (*) on the DNA non-template strand and either consensus base (red) or anti-consensus base (blue) on the DNA template strand at each of positions −3, −2, −1, and +2, relative to TSS. Below, capping efficiencies and consensus/anti-consensus capping efficiency ratios for heteroduplex templates with an abasic site on the DNA non-template strand or, for comparison, for homoduplex templates having a complementary nucleotide on the DNA non-template strand (mean±SD; n=3). The dashed line indicates the value of [ATP] / [NAD+] when the value of NAD+pN / (NAD+pN + pppApN) = 0.5.
See also Figure S5.

